Welcome
Version note: This documentation covers ancoreMaps 3.1, originally published as NPGeoMap 3.1. Historical screenshots and configuration labels may still use the previous name.
Welcome to NPGeoMap 3.1 for Qlik Sense® and QlikView®
NPGeoMap is an Extension for Qlik Sense and QlikView for visualizing geographical business data, to give analytical information on customer behavior, area distribution, case numbers, catchment areas and many more - fast and flexible!
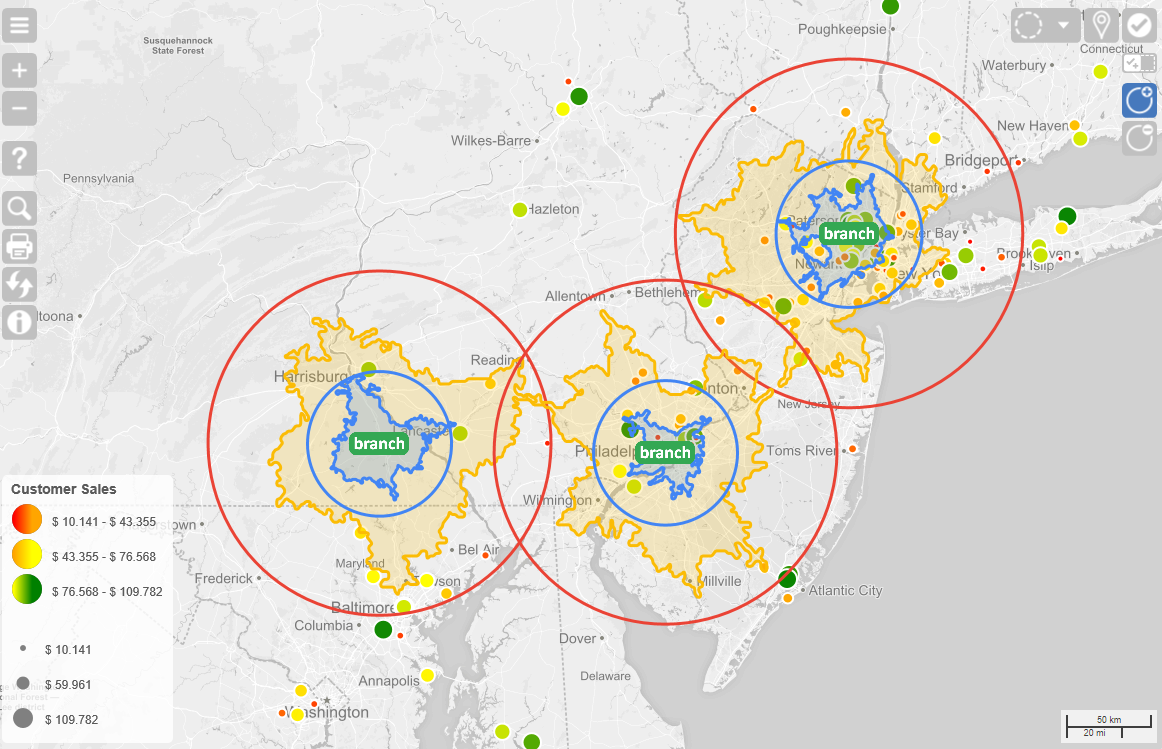
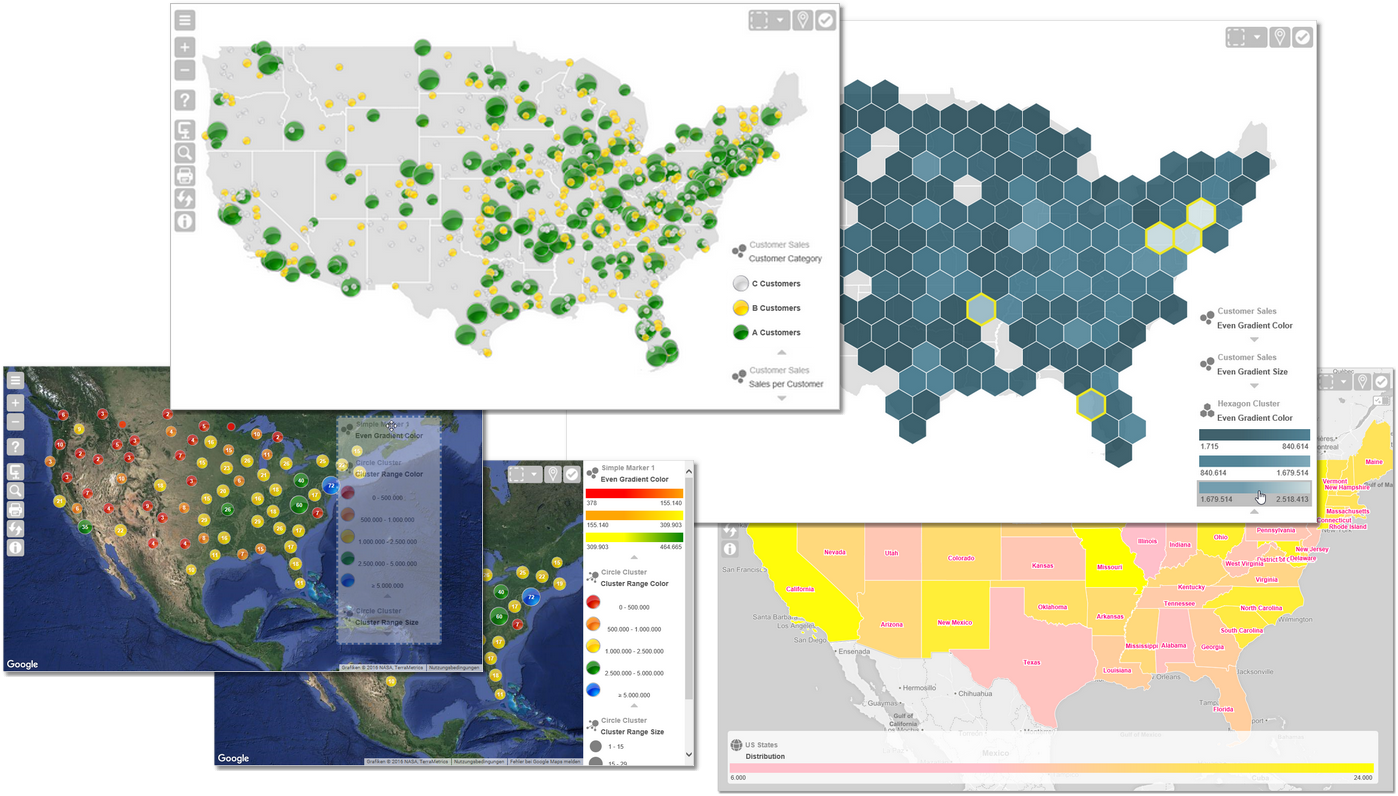
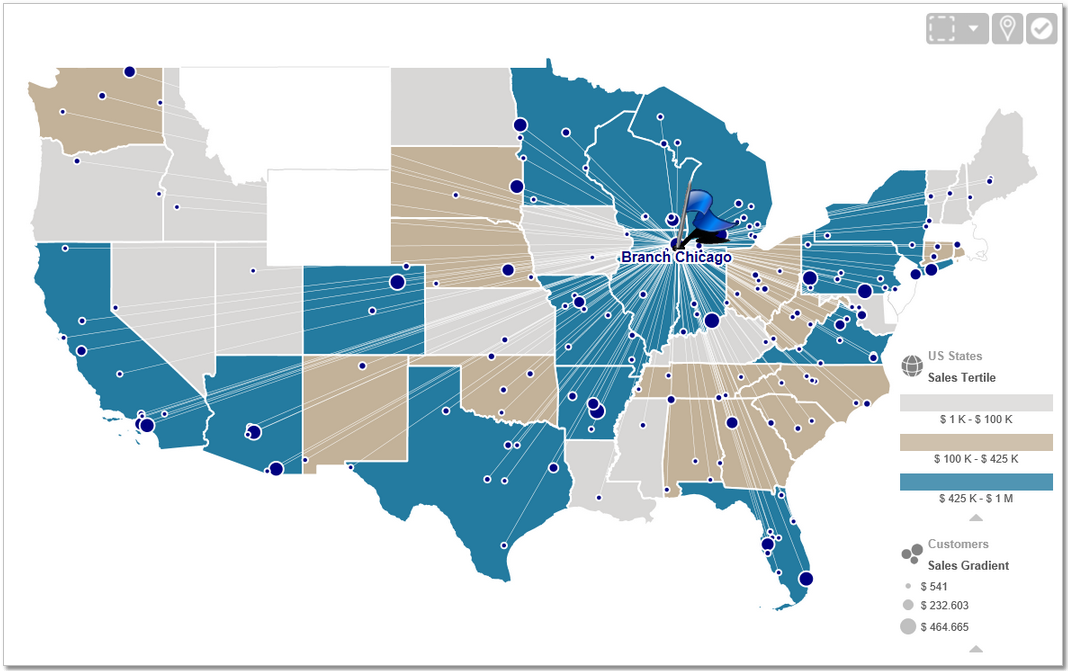
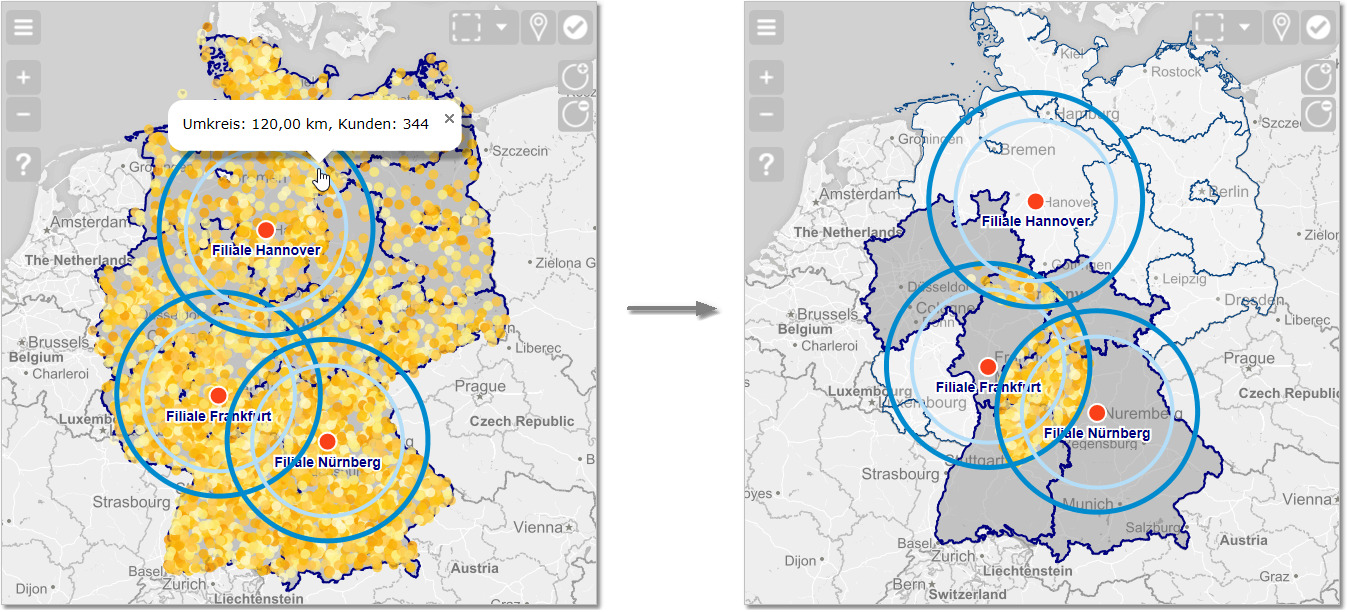
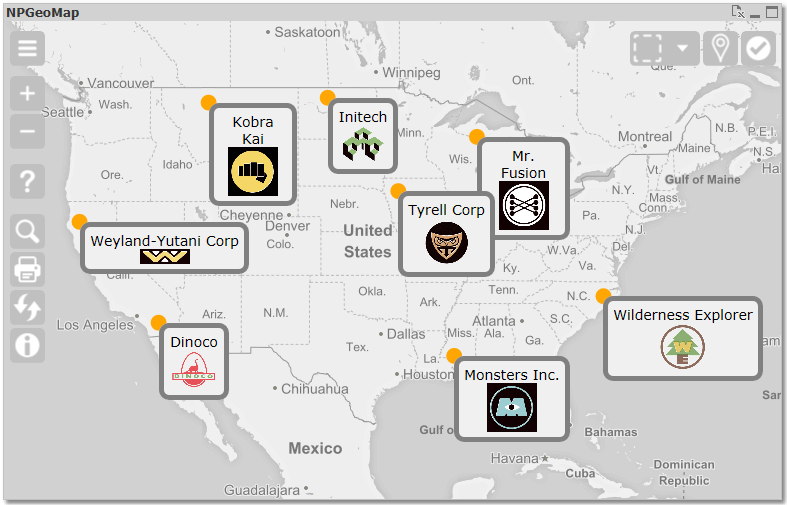
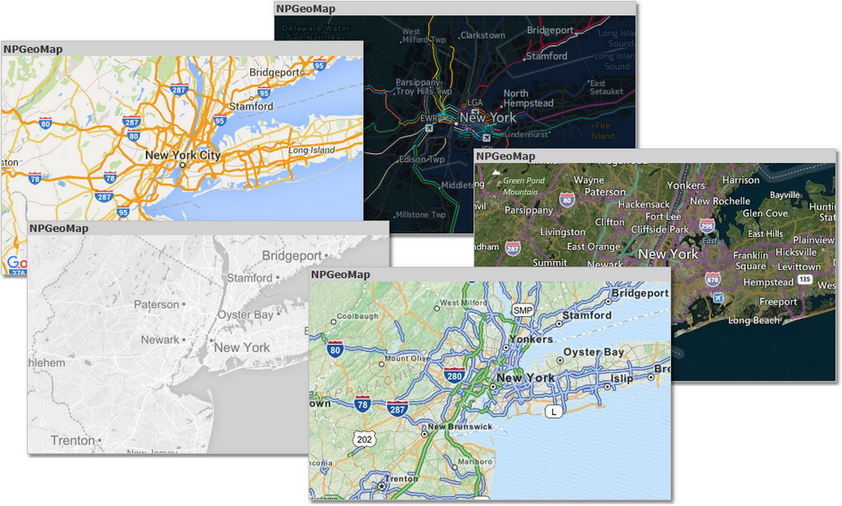
You can display your data with various objects and features - Points, Maps, Lines/Paths, Spheres, Isochrones, Circle Cluster, Hexagon Grid, Choropleth Maps, Heatmaps, Charts, PopUps, MouseOvers, ... and background maps like GoogleMaps, OpenStreetMaps, WMS or your own Tileserver.
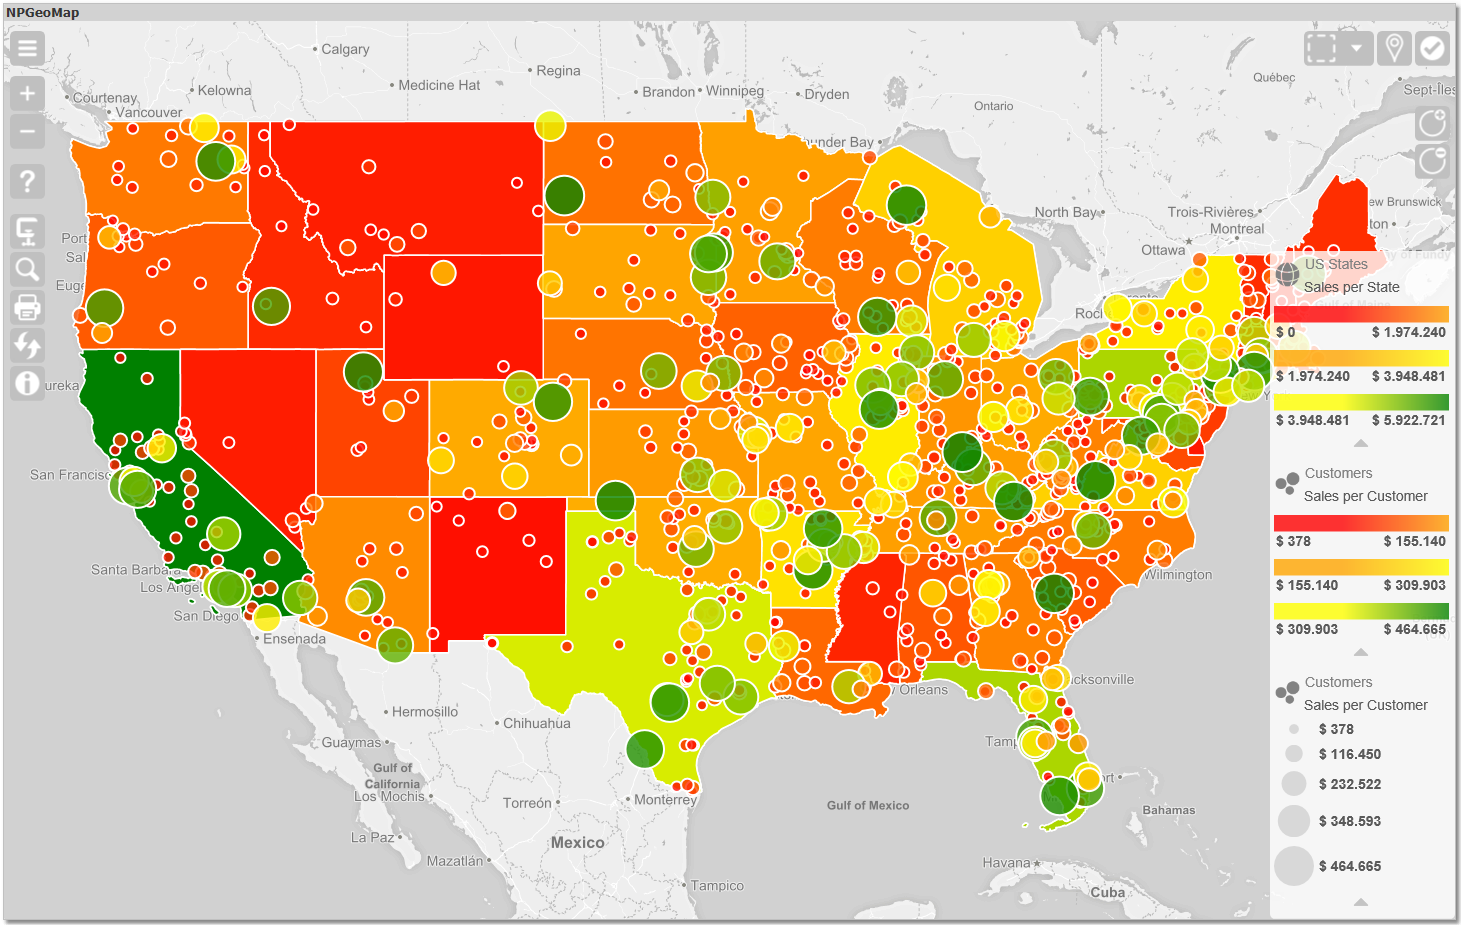
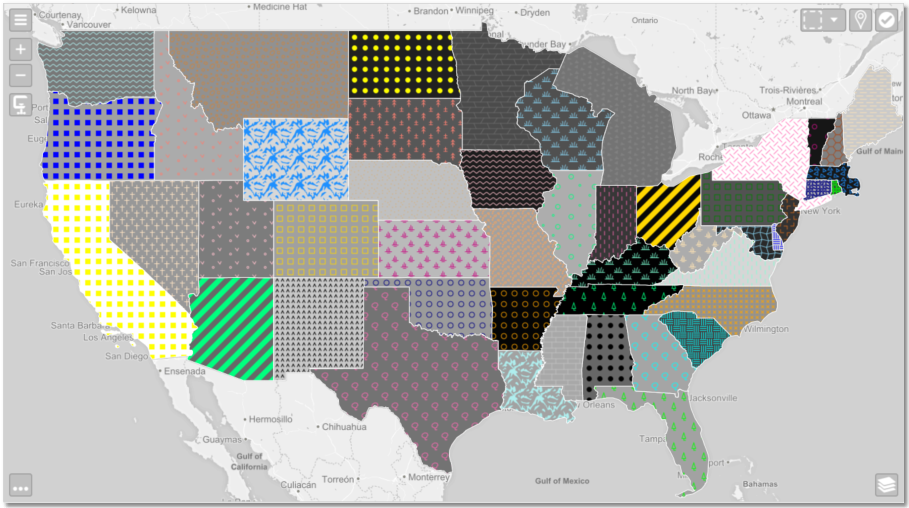
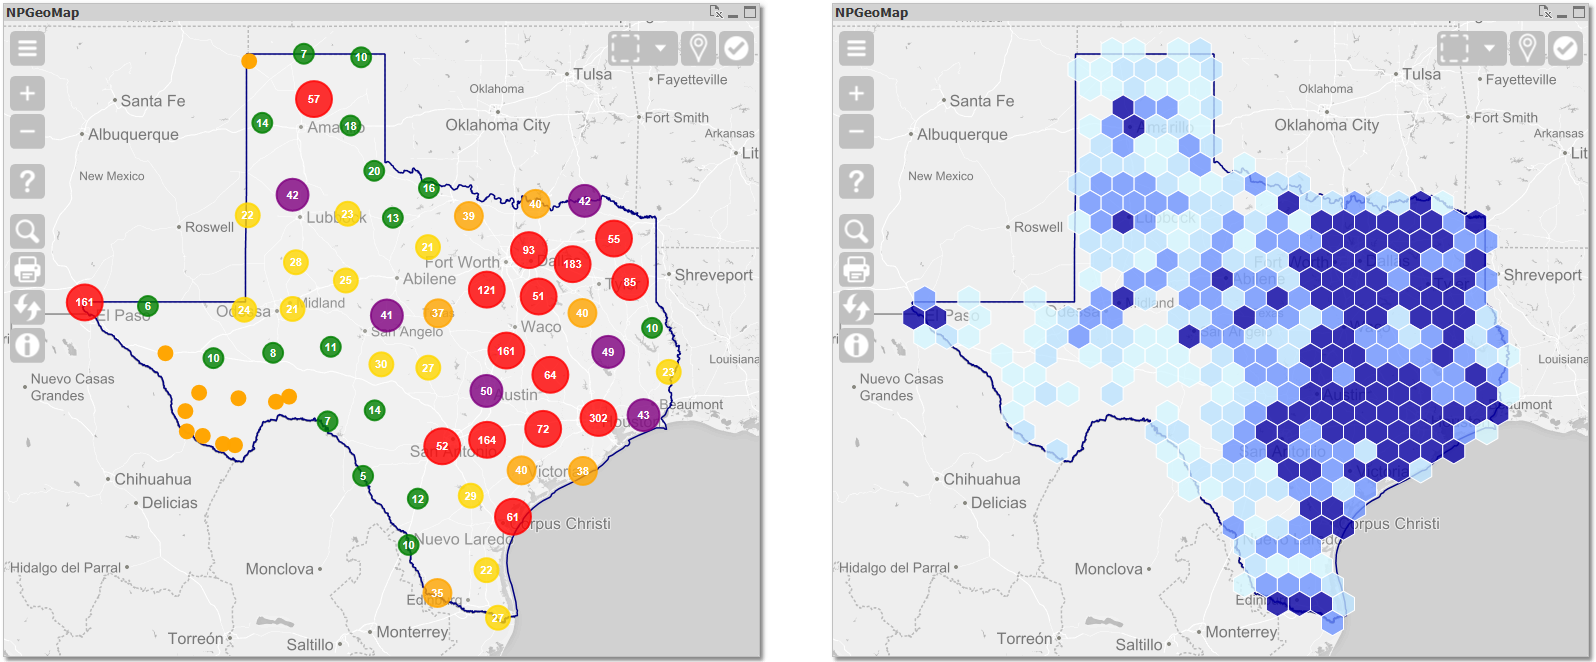
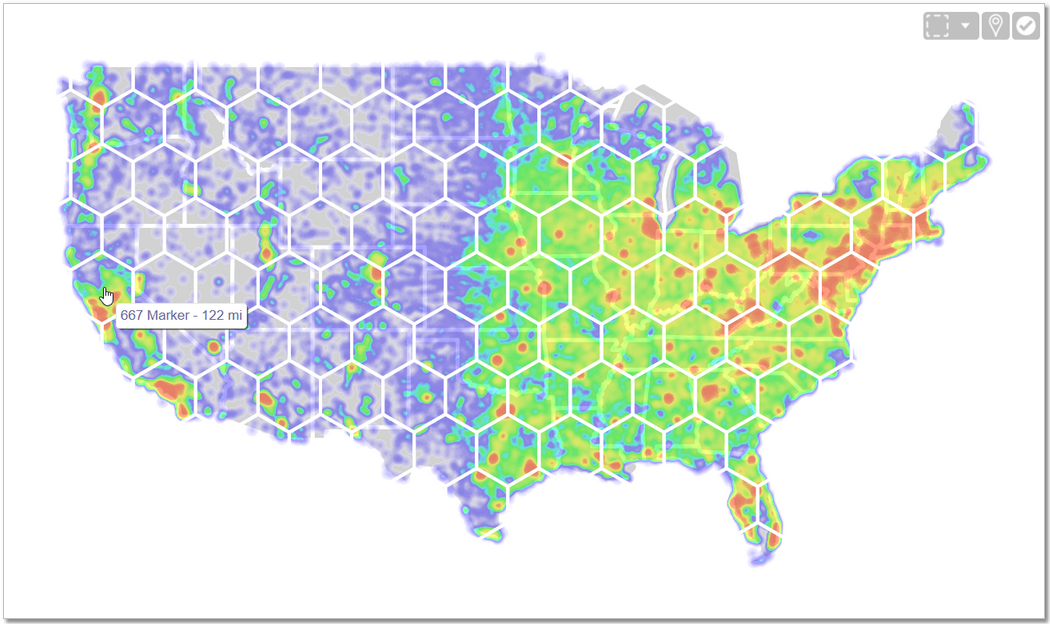
| Color Highlighting Sales and KPIs with automatic Classes | Patterns for Polygons | Circle Cluster and Hexagon Grid (live!) | ||
 |  |  | ||
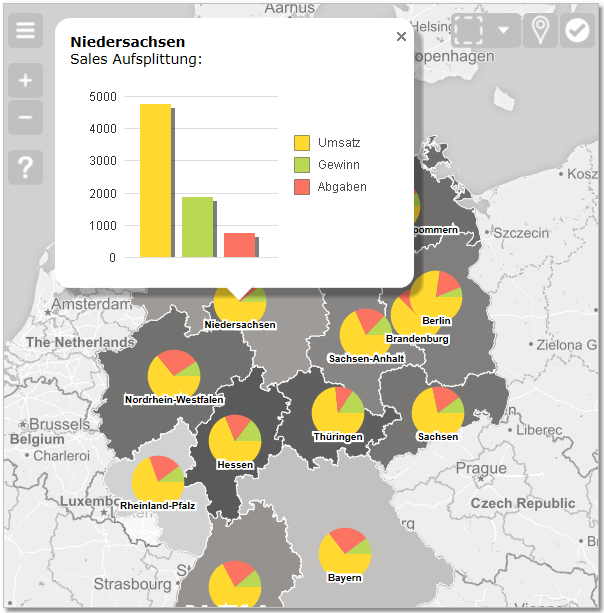
| Charts, PopUps and integrated Qlik visualizations | Isochrones show Areas and Limits of Travel Time or Distance around a starting Point | Comprehensive Legends with Analytical Features | ||
 |  |  | ||
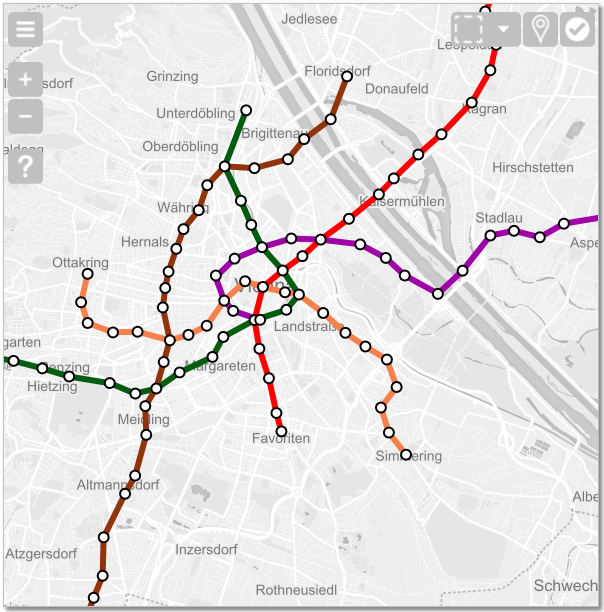
| Display Relations between different Data Groups (Customers, Branches, Suppliers,...) | Catchment Areas and Intersection Selections | Lines and Paths for displaying Routes and Traffic | ||
 |  |  | ||
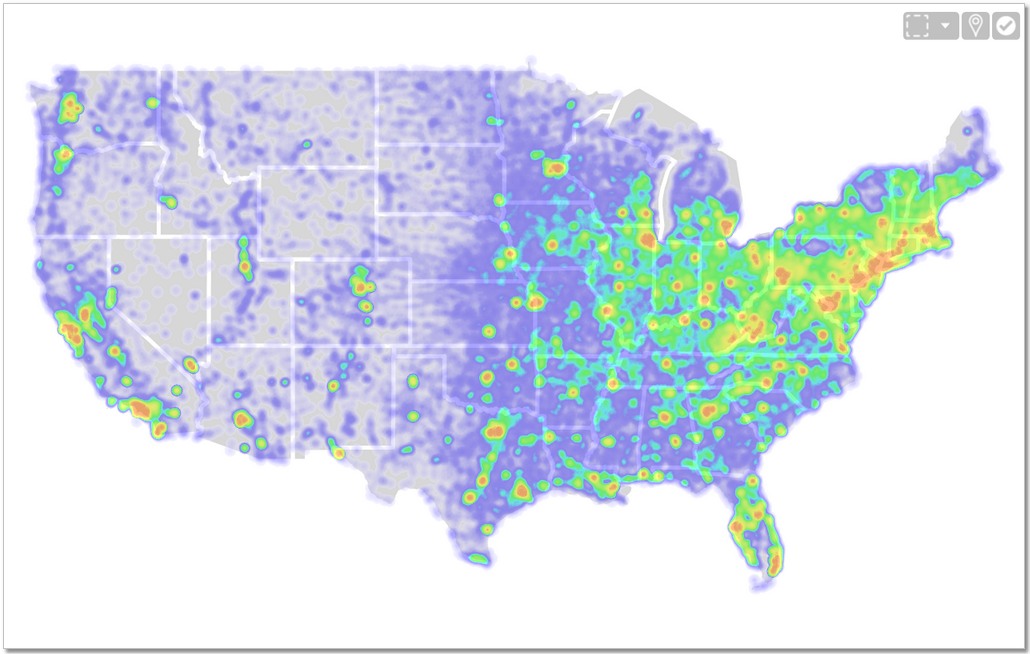
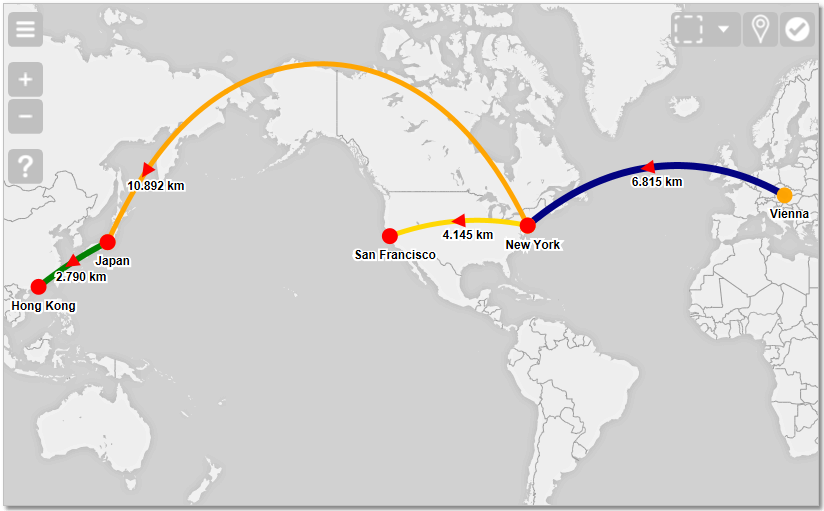
| Show Distribution and Density with a Heatmap | Many Combination Possibilities | Flight Paths and Beelines with Great Circles, even across Date Line | ||
 |  |  | ||
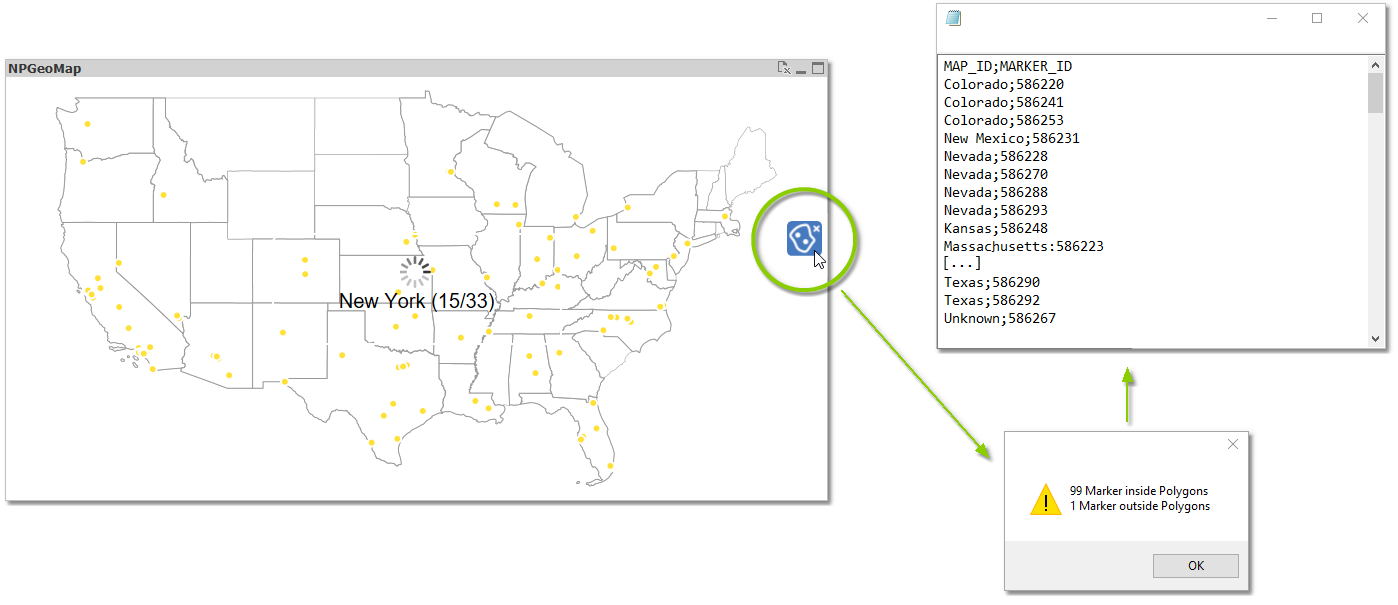
| SVG - draw whatever you need | Tool for automatically relating Markers (Points) to their geographically belonging Polygon (Area) | Wide Range of Background Maps | ||
 |  |  | ||
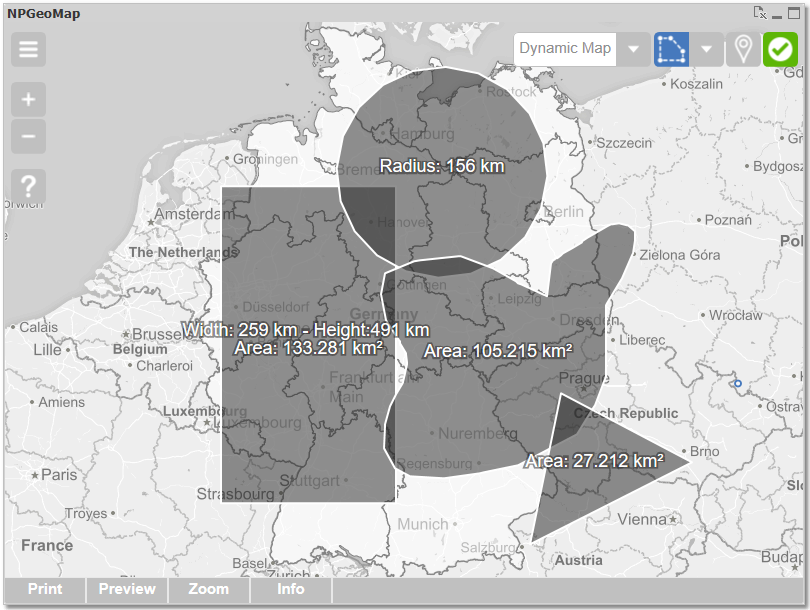
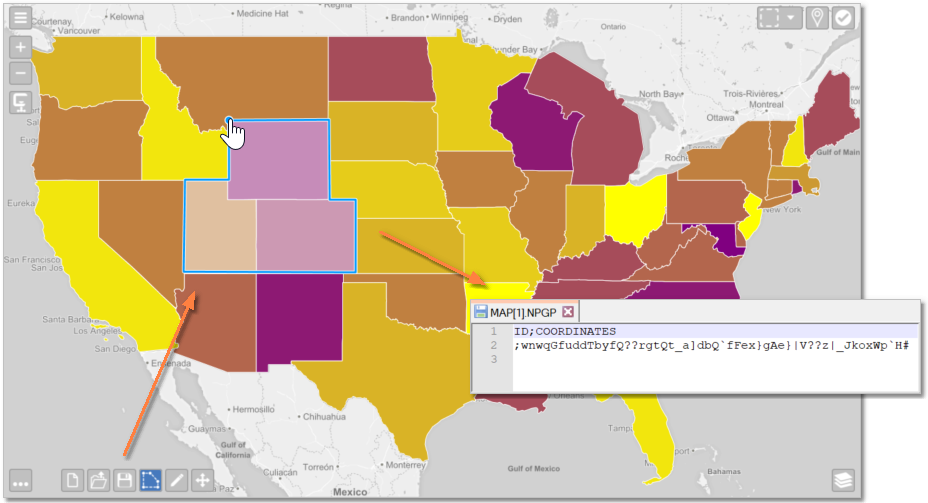
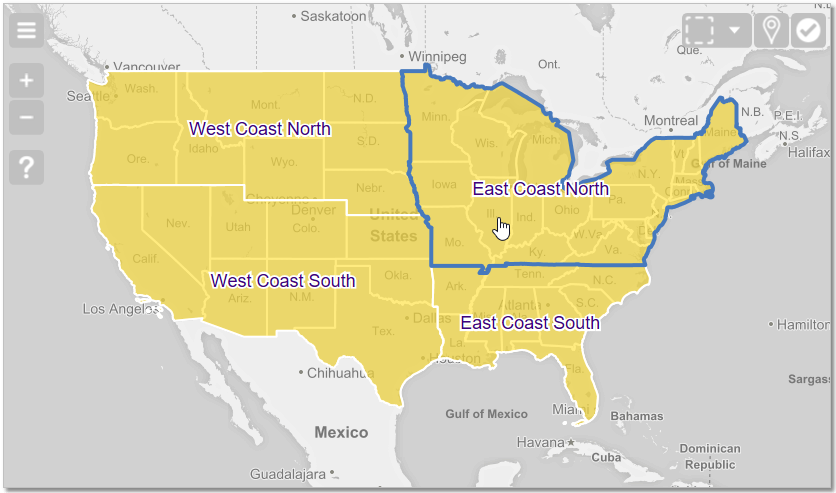
| Comprehensive Options for making Selections | Draw your own Maps on the fly | And with our Add-On NPMapMaker: Create Custom Maps, such as Sales Regions or Catchment Areas | ||
 |  |  |
All features and designs are highly flexible in configuration - presentation, formats, colors, sizes, types, captions, labels, effects, ... The whole object is interactive - many settings are dynamic and can be configured with Qlik formulas, fields and variables. Comprehensive selection possibilities allow an easy, flexible and intelligent reduction of data.
NPGeoMap can be installed with one click and does not require any additional server architecture. It works on any device running an up-to-date HTML5-capable browser (IE 11 or higher, Firefox, Chrome, etc.) and even without an internet connection, NPGeoMap is able to function and produce sophisticated analytical visualizations. Moreover, your data will never leave your network! Because of its special architecture, NPGeoMap is very fast and can visualize even large numbers of data within reasonable time.
So NPGeoMap is just waiting for you to acquire new knowledge and discover your unknown potentials - Good luck!
We hope this Manual can give you answers to all questions. You're welcome to give us your feedback at www.npgeomap.com.
We wish you every success with NPGeoMap,
Peter Noindl, CEO Christian Eckler, Developer, Author Sia Eckler, Author, Quality Management, Graphics