Text Element
Intro
As the name suggests, the text element lets you add your custom text to your ancoreShare report. You can use this element to add headings for your report, page titles, or use the expressions editor to include time/date, KPIs, selected categories, or the author and recipients information to the report.
Besides these, you can also use the text element to specify headers and footers for your report. For example, you may want to add copyright information at the bottom of each page or add a category as a header. All this is possible with ancoreShare Extension.
The following sections explain how you can work with text elements to use their powerful functions.
Basic Settings
Add and select a text object and set general element properties.
While adding Qlik Objects to your report, use the pin icon to see the Preview window showing a preview of your report draft. Use the refresh button to see your changes in preview simultaneously.
Adding text element
- On your Sense sheet, select the ancoreShare button to which you want to add the element.
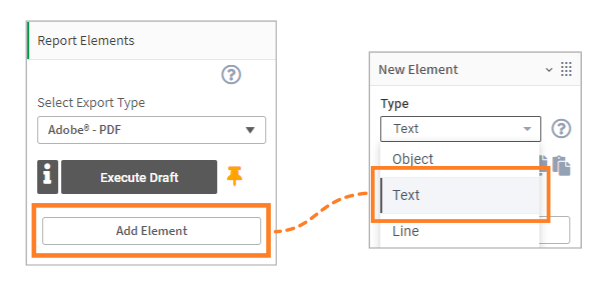
- On the properties panel, click Report Elements > Add Element.
- Click on Type and select Text from the dropdown list.
The Add Element button is always available at the bottom of the properties panel. For multiple elements, please scroll down to see the button.
Caption
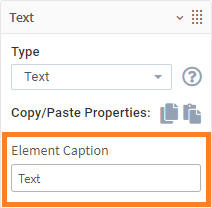
When you add a text element, the caption is automatically populated as Text. You can rename this field to provide a meaningful caption that will help you in navigating through your report elements.
Link to URL
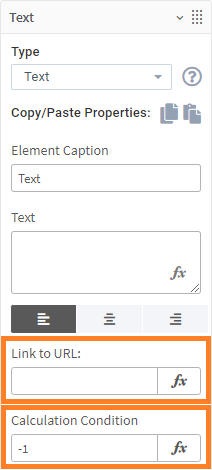
The Link to URL field allows you to add a link to the text element. When the report is generated, the URL is embedded in it. Clicking the text on the report redirects the users to the URL specified here. This is particularly useful when you want users to access the live view of the object in the Sense environment (ensure they have sufficient access rights). You can also use this to redirect users to a website, or any other kind of link.
You will not be able to see or click the link in the Preview window. Download a draft report to verify the correct working of your link.
Calculation condition
In the Calculation Condition field, specify an expression to display the text element. It works just like the activation condition but is specific to each element. You can specify the value as a calculated formula. Refer to the Qlik documentation to know more.
Text element content
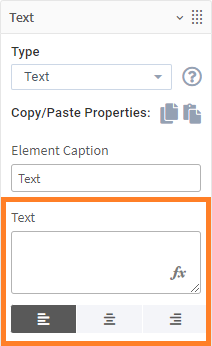
The text field is the area where you can specify the content that needs to go in your text element. You can provide content for headings for your report or page titles, or any other text that you want. Use the expressions editor to include time/date, KPIs, show sums, selected categories, or the author and recipients' information to the report.
Beneath the content field, you can set the alignment for the text content of the element. To align the element as a whole go to Position.
Markdown-style Links
Use Markdown-style links when the PDF should show a readable caption instead of the full URL. Write the link in this format:
[Open documentation](https://docs.ancoresoft.com)
In the generated PDF, only Open documentation is shown, and the text is clickable.
Markdown-style links are applied in PDF exports. Use them when the visible text should be different from the target URL.
Some Examples
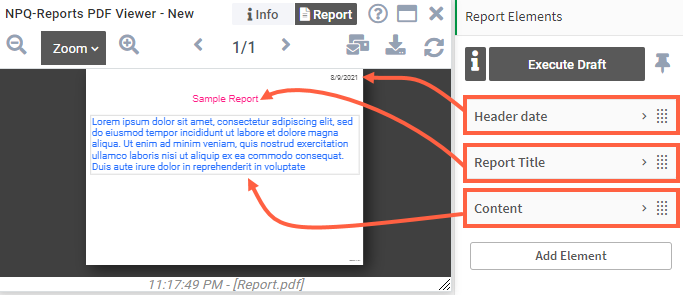
See the result for each example in the images below.
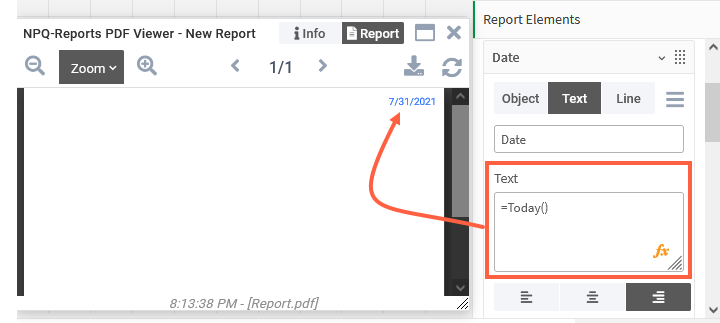
Date: Specify the expression as follows to add the current date to the report.
=Today()
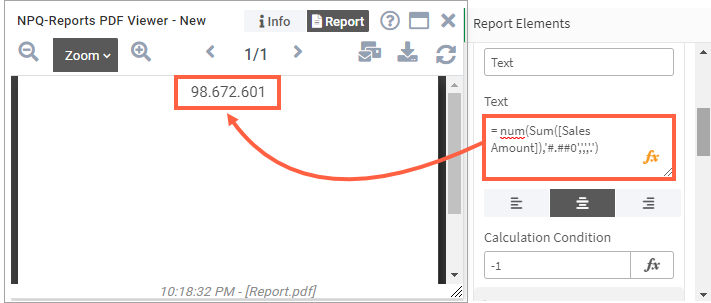
KPI: Specify the expression as follows to add a KPI, such as the sum of sales to the report.
= num(Sum([Sales Amount]),'#.##0',',','.')
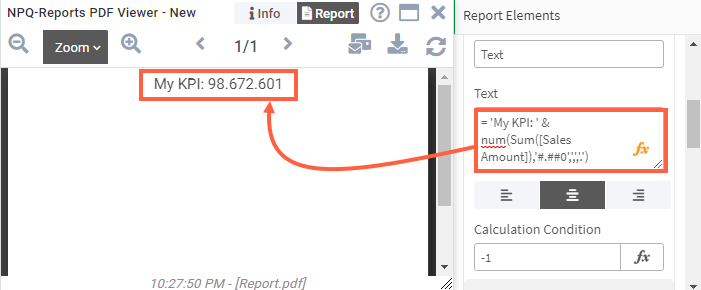
Combine expression with text: Specify the expression as follows to combine your text with a KPI.
= 'My KPI: ' & num(Sum([Sales Amount]),'#.##0',',','.')
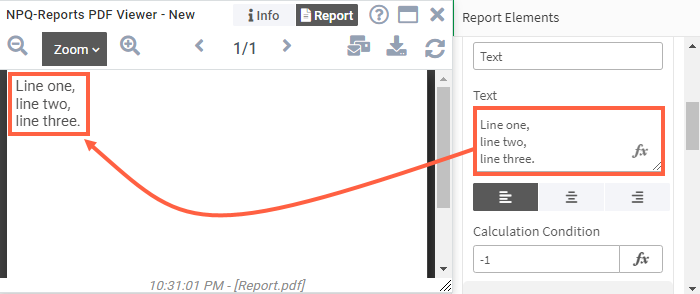
Text with line breaks: For plain text, you can simply use the enter key on the keyboard to start a new line, just like in a text editor. To add line breaks in an expression, use chr(13) (Sense feature).
Line one,
line two,
line three.
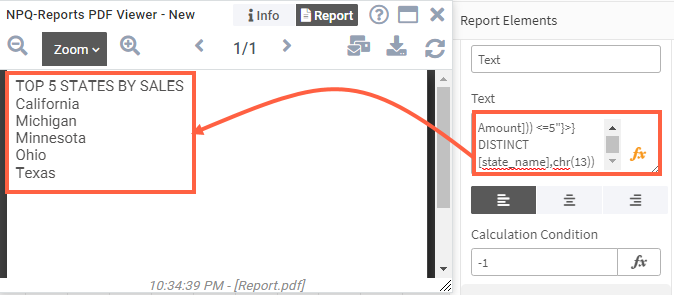
Top 5 rank: In this example, the expression will fetch the current selection (selected states), sort the values of their corresponding sales value, and list the top 5 of them, creating a rank of the 5 top-selling states.
='TOP 5 STATES BY SALES' & chr(13) & concat({<[state_name] = {"=Rank(Sum([Sales Amount])) <=5"}>} DISTINCT [state_name],chr(13))
Refer to the Qlik documentation to know more about the expression editor.
Element Properties
Anchor
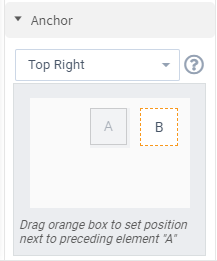
If there is another existing element on your sheet that comes before in order, you will see an Anchor tab. This setting defines the relative position of elements on the report page. Drag the orange box "B" to set the position of this text element with respect to the preceding element "A" or choose an anchor position from the drop-down list above.
To learn more about how all the positioning and sizing settings work together, go to Positioning and Sizing elements. If your element is within a cycle section, please refer to Positioning elements within a Cycle.
Position
Click the Position tab to define general position settings for the text element on your report.
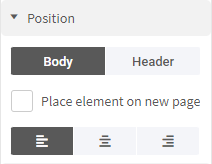
- Specify whether to place the text element in the Body or Header of the report page. Elements in the header will be repeated on every page. For example, use this setting to display a title or the date on every page of your report.
- Optionally, select to Place element on new page to add a new page to the report and start with this there.
- Use the alignment options to align the text element horizontally on the report page.
This property aligns the text element as a whole on the page. To align the text content itself inside the element go back to Basic Settings.
Size
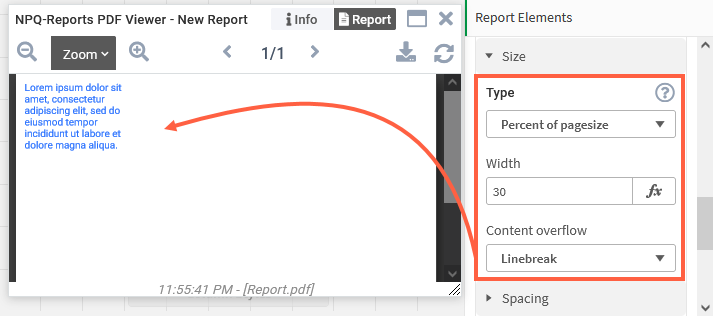
Click the Size tab to set the type and width of the text element size on your report and the content overflow behavior of the text.
Type
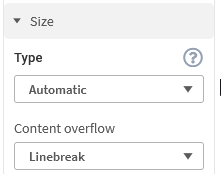
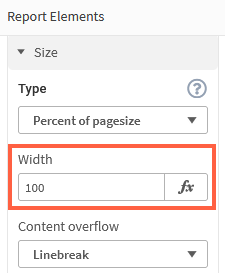
- Automatic: By default, the text element takes 100% of the page width.
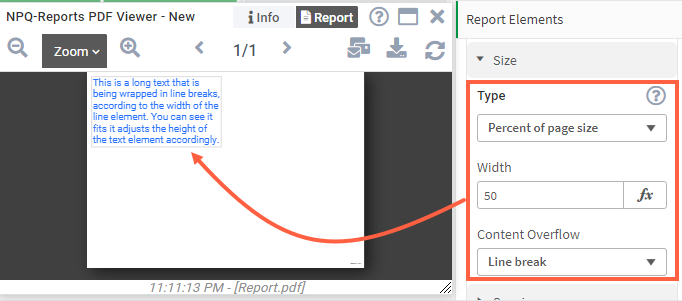
- Percentage of page size: Select this option to define the Width as a percentage of the report page.
- Numeric value: Select this option to provide a specific Width value manually. By default, the width is measured in millimeters, but you can change the page unit in the Report Settings.
Content overflow
- Hidden: The overflow is clipped, and the rest of the content will be invisible.
- Ellipsis: Renders an ellipsis ("...") to represent the clipped text.
- Line break: Acts like a word wrap and inserts a line break every time the text string would overflow the cell.
The text element can only have a width, but no height. If Hidden or Ellipsis is selected, then the text element will just be as high as the one line of text is (depending upon the font size). For Line break, the text element will be as high as the content will fill it.
Spacing
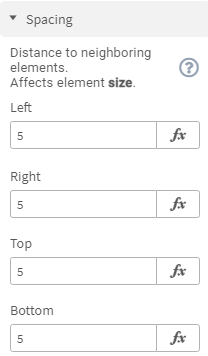
Click the Spacing tab to define the distance of the text element from neighboring elements on your report. You can do this separately for Left, Right, Top, and Bottom. The behavior of spacing depends on the selected size type.
- If you have set the size type as Automatic or Percentage of page size, then the spacing will act as padding and affect the visual size of the text element.
- If you have set the size type as Numeric, the spacing will act as a margin and affect the actual position of the text element.
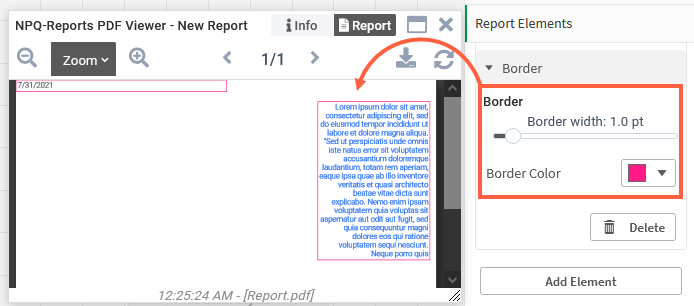
Border
Click the Border tab to add a border around your text element and define the width (thickness) and color of this border.
The border is particularly useful while working with multiple elements, as it forms an outer boundary for your object, and you can clearly see the actual position of various elements.
Font
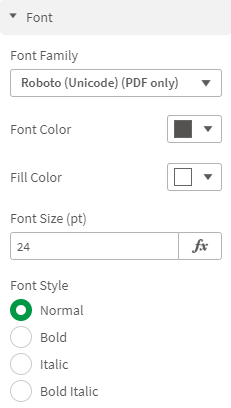
Click the Font tab to specify the font properties of the text element.
- Font Family: Select one of the typeface options from the list.
- Font Color: Use the color picker or provide a HEX code to choose the font color.
- Fill Color: Use the color picker or provide a HEX code to choose a color that will fill the background of the text element.
- Font Size: Specify the font size for the text. You can use the expression for dynamic sizing.
- Font Style: Set the style to Normal, Bold, Italic, or Bold Italic.
Please note, the font settings apply to the whole text element. To define specific font styles for different content types, add separate text elements for each type.
Cell Padding
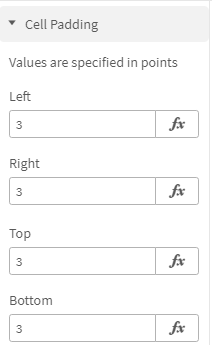
Click the Cell Padding tab to define an inwards distance of text element content from the element boundary. You can do this separately for Left, Right, Top, and Bottom.
The cell padding value is always specified in points (pt).
Note
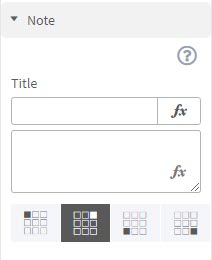
You can add Notes to your text elements to provide additional information to your users – for example to comment on something, draw attention to a specific area in the report, or give some context for colleagues.
To add a note:
- Specify the Title (optional) and Note in the corresponding fields.
- Alternatively, click fx to open the expression editor and provide the Title and/or notes using Qlik Expressions.
- You can also specify the Position of the note with respect to the object: top-left, top-right, bottom-left or bottom-right.
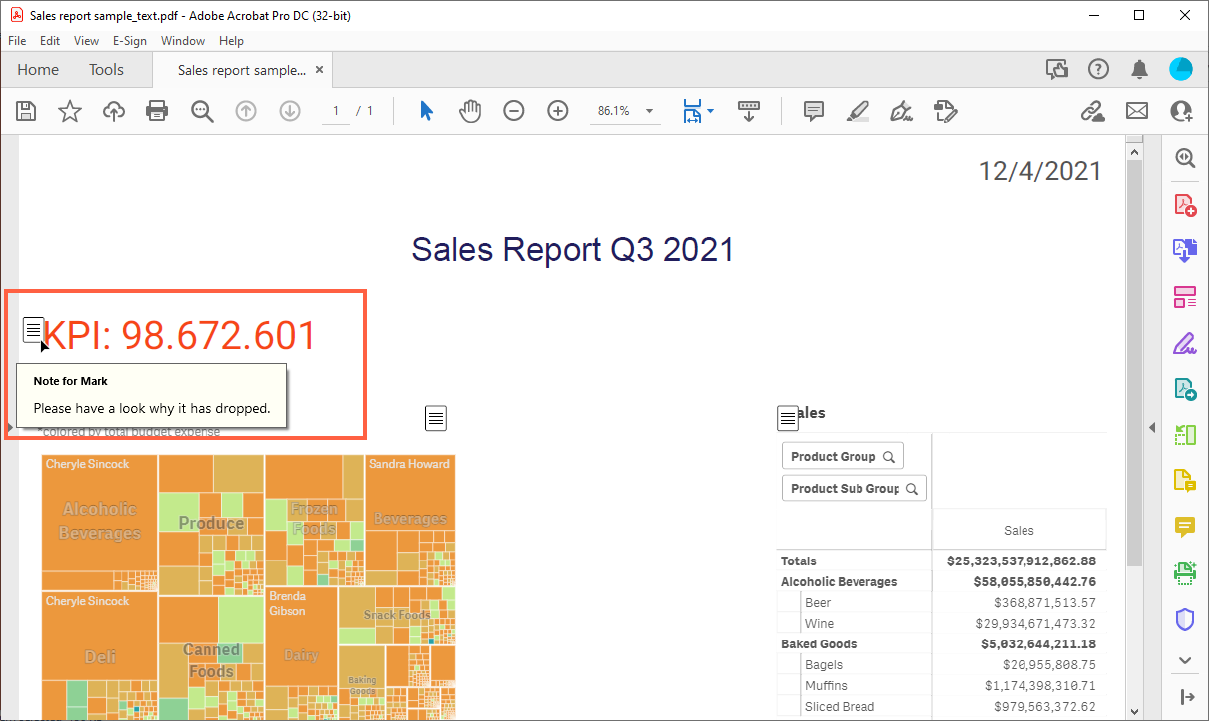
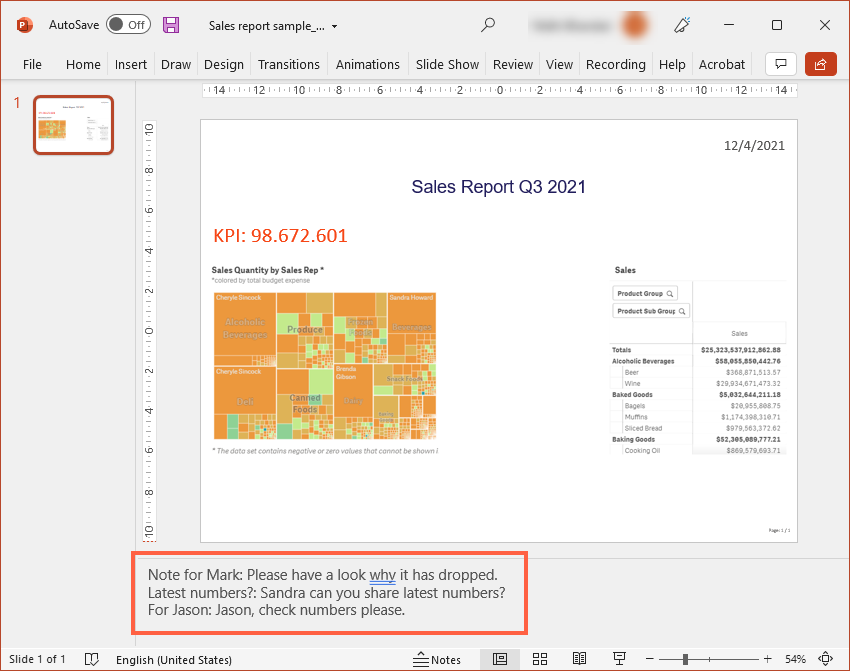
If you generate a PDF report, then the notes are exported as actual annotations in the PDF file. Users with sufficient privileges can further edit them too. In PPTX exports, the notes are shown collectively in the Notes area at the bottom of each slide – use Titles to segregate them for each element.
You will not be able to see the notes in the Preview window. Download a draft report to see the notes.
TOC Table of Contents
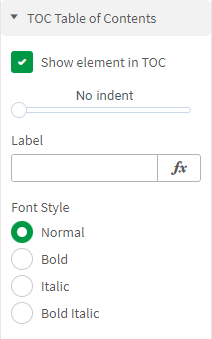
If you added a TOC element to your report, you can choose for each other element, if it should appear in the table of contents or not.
- Show element in TOC: This is enabled by default and also applies should the TOC be set to Bookmarks only.
- Indent: The indent can also be set individually for each element in your TOC, creating a topic hierarchy.
- Label: By default the element's Caption is populated as a label in the TOC, but you can choose a separate one just for display in the TOC here.
- Font Style: This property can also be set individually for each element.
These TOC settings are only visible, if the element is assigned to the Body of the report (default), not if it's in the Header. You can change this under Position.
Deleting text element
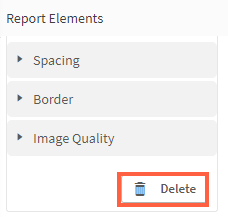
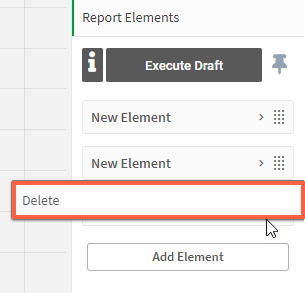
At any time, you can click the Delete button to delete the text element. Optionally, right-click the element in the properties panel and click Delete.
Next Steps
- Now add Charts, Tables or Lines to your report
- Learn more about positioning all elements
- See a report draft in the preview window
- Or, share and export the report