Radial Spheres Settings
| RadialSpheres Referes to all Spheres: Features for generally activating the Spheres, setting a small menu to add Spheres or Pins manually, for setting an image in the center of the sphere (or as a Pin) and for setting coordinates for Spheres or Pins with a fixed position. spheres One block for each Sphere (kind): Features for setting radius/distance, selection, appearance and PopUp. Several blocks of different Spheres will be displayed concentric (either at the above set coordinates or - with enabled menu - by clicking somewhere on the map). |

Attention``: For using Isochrones a HERE apikey or appcode and appid are required!
| Note: The values for nearly all features may be entered as calculated formulas or variables. |
| For detailed information about notation in this dialogs go to chapter The fx-editor. |
| RADIAL SPHERES SETTINGS | ||
|---|---|---|
| SETTING / VALUES | EXPLANATION | |
| active true Spheres basically enabled false Spheres basically disabled (default) | Feature to basically enable or disable the Radial Spheres Layer. This feature can be useful to define a Qlik variable and then set a button in the application, so that the user can switch on and off all Spheres. With the Layerswitcher the whole Sphere layer can be hidden/unhidden as well - but in that way the data will be loaded anyway, therefore this is more a quick tool when working on the map. To increase performance in the app better actually disable the Spheres with this feature, if you don't need them. | |
| menu true Spheres menu button enabled false Spheres menu button disabled (default) | This feature enables a further button in the menu bar (as well as in the touchscreen menu, when activated), which offers to add Spheres (or Pins) manually at run time. The Spheres can also be deleted again and they can be used as a selection tool. If you click on the Spheres button, you switch to the "set-Spheres-mode". Now you can add any number of Spheres to your map. In this mode PopUps, selections and other functions are deactivated. To confirm and exit this mode, click the button again. At this point the "delete-Spheres-button" is enabled automatically. By clicking it always the last added Sphere will be deleted. These manually set Spheres will stay until the map is reloaded, for example if you restart the application or refresh with F5 . | 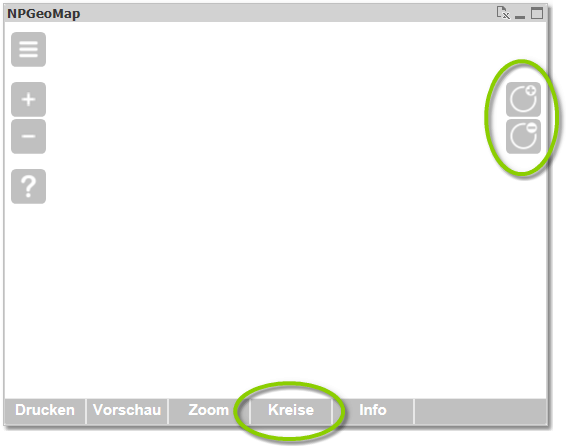 |
| export | enables a button and the feature to export the manually set Spheres on your current Map in a ".txt" file | |
| intersect | enables a button and the feature to add intersection-spheres that intersect between two or more spheres | |
| coordinates coordinates Spheres center coordinates | Set the coordinates of the Sphere center or several coordinates for various Spheres with different centers. The coordinates have to come in WGS 84 format. Notation: First latitude, then longitude (hint: in NPGeoMap always in alphabetical order). They have to be separated with a comma and the decimal separator has to be a dot: >> Example: 48.207854, 16.369722 Several coordinates are separated with a semicolon (to link several coordinates you can also use the Qlik formula Concat). In your data model this notation should be applied too. Manually filled in coordinates count as string, that's why they have to be quoted. Basically there are three different ways to load the coordinates: oLoad coordinates out of the Qlik data model, both coordinates (lat. and lon.) are in one column. oLoad coordinates out of the Qlik data model, coordinates (lat. and lon.) are in two separated columns. oOne or more coordinates are filled in manually. Example for loading coordinates out of the Qlik data model: Latitude and longitude are in one column: "coordinates": "' & COORDINATES & '", Latitude and longitude are in two separated columns: "coordinates": "' & Concat(LATITUDE & ',' & LONGITUDE,';') & '", Note: Formula templates like this are in every Dialog. Example for filling in coordinated manually: "coordinates": "51.109790, 10.647978; 48.207854, 16.369722",  Tip: You can also use coordinates in Encoded Polylines format - more information at developers.google.com. Tip: You can also use coordinates in Encoded Polylines format - more information at developers.google.com. | |
| excludefromzoom | true/false - exclude the Spheres from the automatic zoom/view | |
| image image path file path of an image, displayed in the center of all Spheres | Set the name (and path) of an image to display it in each Sphere center. The image file has to be located within the NPGeoMap extension directory (sub folder "images"): Qlik Sense: C:\Users[username]\Documents\Qlik\Sense\Extensions\NPGeoMapSense_v3\images QlikView: C:\Users[username]\AppData\Local\QlikTech\QlikView\Extensions\Objects\NPGeoMap_v3\NPGeoMap_v3_Basic\images If the file is saved directly in "images" only the file name has to be set here. Otherwise the image path after "images" has to be given as well. Example file in "images": "image": "image.png" Example file in further sub folder "logos": "image": "logos\image.png" | 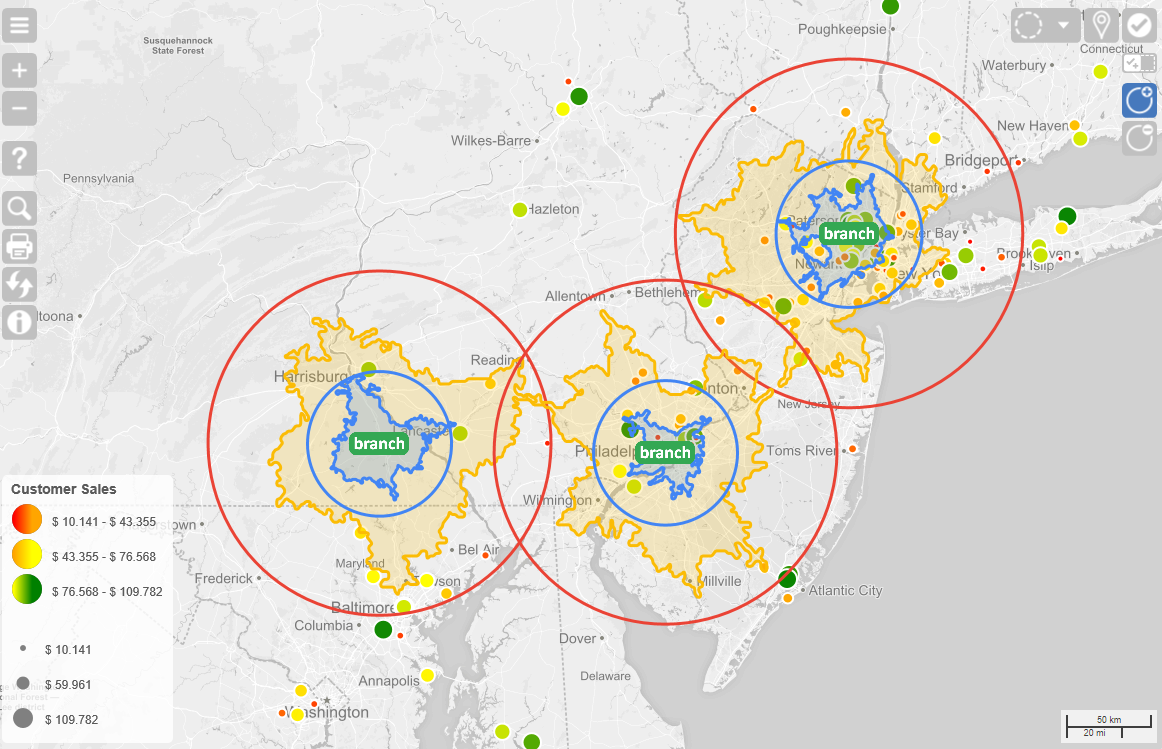 |
| In combination with setting the feature "distance" below to 0 Pins can be created. This may be helpful for marking points on the map. Suitable are especially images of flags (like for example the supplied file "flag.png"). If the distance is 0 only the image will be displayed. Make sure to enable both "active" features (above and below) as well as the the feature "menu" above to set Pins manually on the map. It's also possible to use so called "animated GIFs" to display moving images (for example the supplied file "Demo\anim_arrow.gif"). More details about notation in chapter fx-editor | 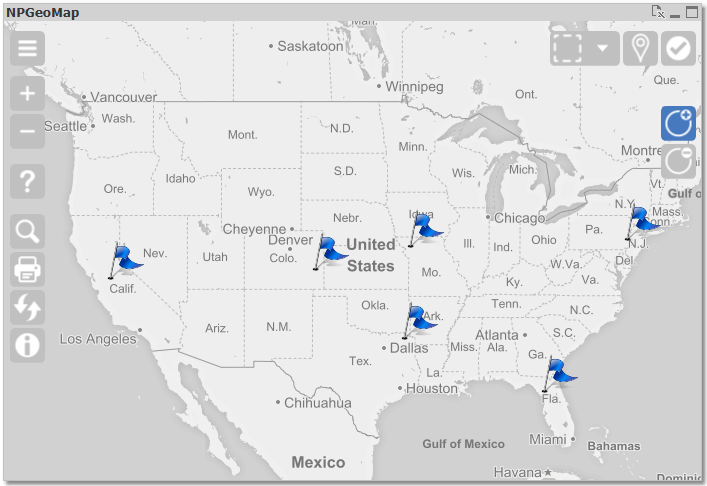 | |
| imagesize number width of the image in pixel - height is calculated automatically (default is 30) | Configure the size of the image set above. You only have to give the width of the image - the height will be calculated automatically. The image always will be centered above the Sphere coordinates (or the clicked point on the map). | |
| kpiformat | default format of KPI values, set inside set in respective layers (Marker, Polygon, Line) comma symbolizes thousands separator, point stands for decimal delimiter and the zeros after the point are the decimal places | |
| spheres | In this section are features to set a selection type, size (distance/radius), appearance (colors, transparency, line style) and PopUps with Qlik visualizations for Spheres. You can copy this block in the fx-editor within the array and separate them with a comma, to create several concentric Spheres (Spheres with the same center) - see screenshot on the right. The concentric Spheres can then be configured individually. A block begins and ends always with curly brackets {} and all blocks are enclosed with square brackets [] (see screenshot on the right). | 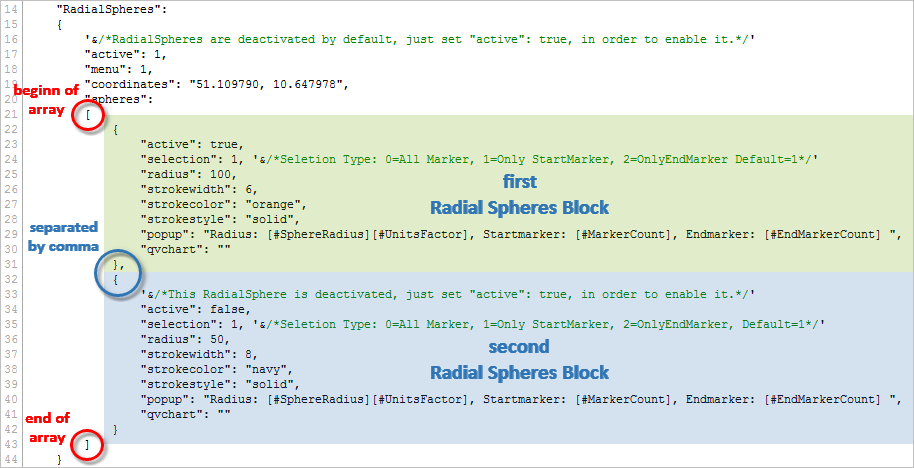 |
| active true Spheres of this kind respectively in this block enabled false Spheres of this kind respectively in this block disabled (default) | Each of the individual blocks of concentric Spheres in this array can be enabled or disabled with this feature. If nothing is filled in or if the feature is deleted, the internal value will be set on "true" (this is for downward compatibility of the software). By default the value "false" is filled in. | |
| selection number defines which type of Marker will be selected within the Sphere (default is 1, StartMarkers) | Spheres can be used as a selection tool, especially to take intersection selections or to determine catchment areas. This feature defines, which type of Markers/objects are selected by the Spheres: 0 = all Markers 1 = only (start)Markers 2 = only Endmarkers 3 = Polygons More details about Markers and Endmarkers in chapter Dynamic Marker Layer. | |
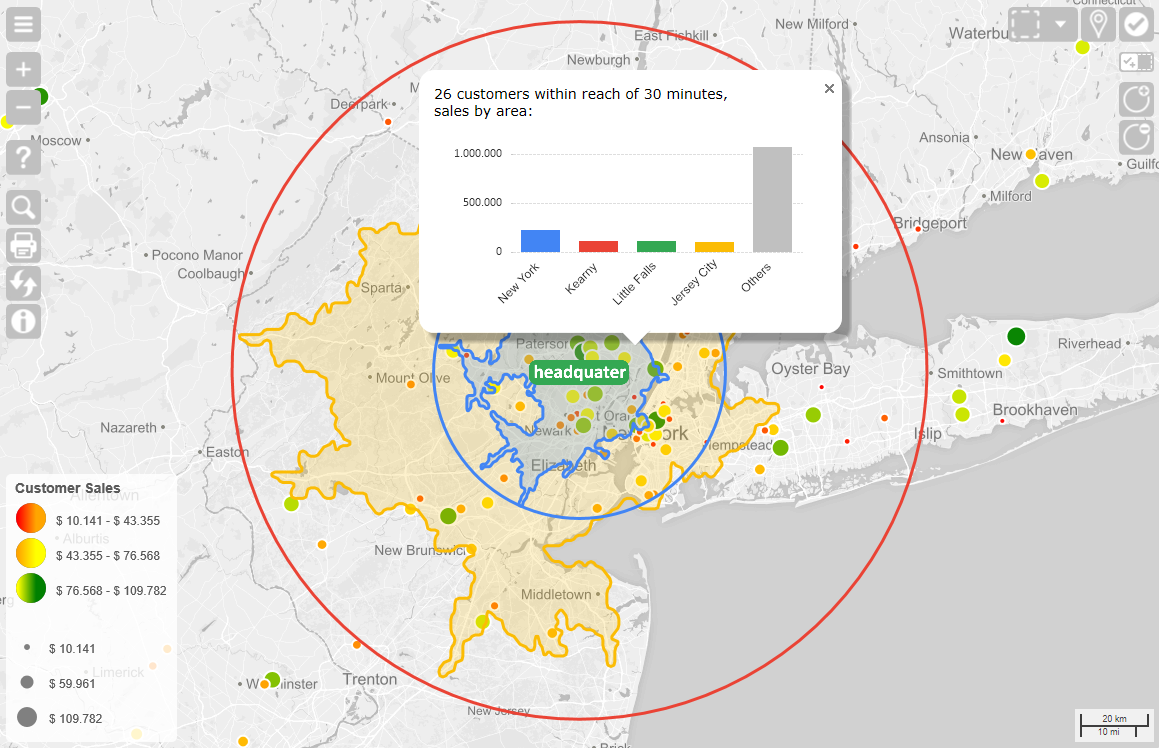
| type number Sphere type (default is 0, Radial Sphere) | Define the kind of Sphere: 0 = Radial Sphere (circle) 1 = Isochrone Time (catchment area in minutes) 2 = Isochrone Distance (catchment area in kilometers or miles) Explanation: An Isochrone is a perimeter out of points around a center which all can be reached either in the same time or within the same amount of kilometers/miles on roads. Therefore it creates catchment areas. In contrast Radial Spheres just show a circuit in beeline distance. | |
| areacoveredtoselect | how many percent of a Polygon surface must be covered by this Sphere to handle the Polygon as "selected" (-1 will use layer settings of the respective Polygon layer) | |
| distance number radius/time/distance of Sphere - unit set in unitsFactor | Set the radius of a Radial Sphere or the distance/time of an Isochrone, depending on the Sphere type above. type 0 = kilometers/miles of beeline radius type 1 = travel time in minutes type 2 = driving distance in kilometers/miles Attention``: This feature used to be called "radius" - it was renamed since Isochrones are provided. Former built apps are still compatible! | |
| travelmode text parameter for calculating Isochrones | If type 1 or 2 is set above, this feature configures several options for Isochrones: Type - "fastest" or "shortest" defines if calculating the fastest or the shortest route TransportMode - "car" or "pedestrian" defines if route is calculated for a car or a pedestrian - depending on your HERE license there are several more options (learn more) TrafficMode - "traffic:enabled" or "traffic:disabled" defines if information about current traffic situation should be included in calculation These parameters are set like text, separated by semicolon. Example: "travelmode": "shortest;car;traffic:disabled", More information about travelmode from the provider HERE: developer.here.com Further make sure to have a valid license. Learn more about HERE. | |
| reversegeocode 1 geocoding on address level activated -1 off (default) | Instead of geocoding coordinates out of an address, this feature reverse geocodes the coordinates of the sphere center point and returns the address to the NPGeoMap HashtagVariables [#RGAddress] and [#RGEAdress]. Those can be set inside a popup to show the address of the spheres center point by click. A valid HERE API key is required; see the official HERE API key guide. | |
| fillcolor color Sphere fill color (default is empty) | Sphere fill color. Defines if the Sphere is displayed as a ring or an area. Besides the appearance it also defines the "clickability" of the Sphere object, respectively the one of the objects inside the Sphere. As soon as a color is set here, the Sphere is calculated as an area (kind of a Polygon) and overlays all objects beneath - like Markers, Lines etc. - which makes them impossible to click. However the Sphere itself can be clicked more easily (e.g. PopUps can be opened by clicking "inside" the Sphere, like on a Polygon unlike clicking exactly on the edge). When setting colors you can use Hex-Codes, HTML color names or RGB Example``: color red = #FF0000 or red or RGB(255, 0, 0) (Detailed information in chapter fx-editor) | |
| opacity number transparency of the fill color in percent | Transparency of the fill color: 0% - colors are covering 100% - completely transparent (Attention: If there's a color set anyway, objects inside the Sphere still can't be clicked - only the Sphere itself!) | |
| strokewidth number line thickness of the Spheres in pixel (default is 6) | Set the stroke width of the Sphere border in pixel. | |
| strokecolor color color of the Sphere border (default is orange) | Sets color of the Sphere border. When setting colors you can use Hex-Codes, HTML color names or RGB Example``: color red = #FF0000 or red or RGB(255, 0, 0) (Detailed information in chapter fx-editor) | |
| strokestyle type type of Sphere border (default is solid) | Stroke style of the Sphere border. Available types: solid dot dash dashdot longdash longdashdot Pro tip: This feature supports SLD. |  |
| label | Label displayed on origin/center of Sphere - !Attention!: if you set several different labels in each Sphere section here, they will overlap! (just set a label in only one section) | |
| tooltip | Information displayed when cursor hovers over object. You can use several NPGeoMap [#Hashtag] variables in here (see list below in "popup") - just add them like text! e.g.: "Distance: [#Distance][#Units], Count: [#Count], KPI:[#KPI]", Calculating expressions must be in curly brackets {} - e.g.: "{[#KPI]/[#Count]}" Use only numbers and numeric NPGeoMap [#Hashtag] variables for calculating. | |
| popup content PopUp content | A PopUp is a kind of dialog or a small window, that opens or "pops up" if you click on an object (Marker, Polygons,...), for which a PopUp is defined. NPGeoMap can display text and dynamic content in a Popup. The following NPGeoMap #Hashtag Variables can be used for tooltip and popup: o``[#Distance]``* Sphere distance set above o``[#Units] distance unit (minutes or the value set inside APPEREANCE SETTINGS "usemetricunits") o``[#Count] amount of objects inside the Sphere o``[#KPI] total KPI (set in respective layer) as well as all your custom KPI variables, e.g. [#KPIyourname] these variables are set inside the respective layer (MARKER SETTINGS, LINE SETTINGS or MAP SETTINGS) and contain numeric values Spheres can add up the KPIs of enclosed or intersected items o``[#KPI%] relative KPI if you add "%" to your KPI variables, you get the relative share based on the actual intersected area of Sphere and Polygons, instead of the total KPI (Polygons only!) for example: "popup": "Sales share in €: [#KPIsales%], total Sales: [#KPIsales]", | 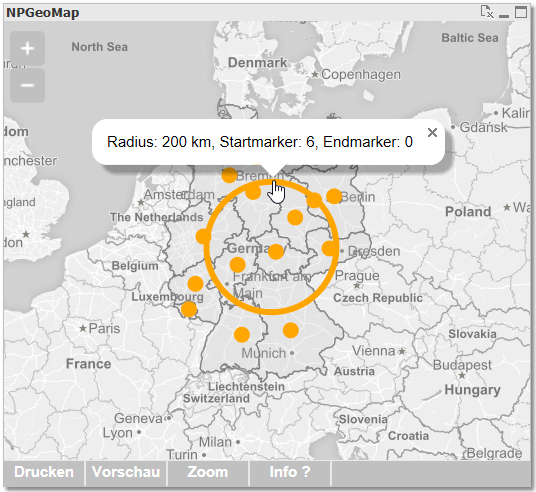 |
o``[#Latitude] and [#Longitude] Current Sphere WGS84 Latitude/Longitude Coordinate o``[#Latitude-F] and [#Longitude-F] First Sphere WGS84 Latitude/Longitude Coordinate o``[#Latitude-P] and [#Longitude-P] Previous Sphere WGS84 Latitude/Longitude Coordinate o``[#Coordinates] `All Coordinates between First and Current Sphere | separated. o[#PRJ=EPSG:xxx]` `Convert #Latitude and #Longitude Variables by the provided EPSG code.` `o[#RG-xxx] or [#RGE-xxx] Returns Reverse geocoded (Encoded) Address Information. o[#RG-Address] Reverse geocoded - full resolved Address` `o[#RG-Country] Reverse geocoded Country o[#RG-County] Reverse geocoded County` `o[#RG-City] Reverse geocoded City o[#RG-State] Reverse geocoded State` `o[#RG-District] Reverse geocoded District o[#RG-Street] Reverse geocoded Street` `o[#RG-HouseNumber] Reverse geocoded HouseNumber o[#RG-Postalcode] Reverse geocoded Postalcode` `Some nice Examples for the coordinates variables:` `simple coordinates:` "popup": "[#Latitude] / [#Longitude]" `converted coordinates:` "popup": "[#Latitude] / [#Longitude] [#PRJ=EPSG:31252]" `integrating` `GoogleMaps Streetview: "popup": "<iframe width=600 height=450 frameborder=0 style=border:0 src=https://www.google.com/maps/embed/v1/streetview?key=[yourGoogleMapsKey]&location=[#Latitude],[#Longitude]&heading=0&pitch=10&fov=35 allowfullscreen></iframe>" integrating GoogleMaps Routing``: "popup": "<iframe width=600 height=450 frameborder=0 style=border:0 src=https://www.google.com/maps/embed/v1/directions?key=[yourGoogleMapsKey]&origin=[#Latitude-F],[#Longitude-F]&destination=[#Latitude],[#Longitude]&waypoints=[#Coordinates] allowfullscreen></iframe>" Check it out! (See details about notation in chapter *[fx](/ancoremaps/docs/fx-editor#notations)*[-editor](/ancoremaps/docs/fx-editor)). Example: "popup": "Radius: [#SphereRadius][#UnitsFactor], Startmarker: [#MarkerCount], Endmarker: [#EndMarkerCount]" **Calculating expressions** must be in curly brackets {} - e.g.: "{[#KPI]/[#Count]}" Use only numbers and numeric NPGeoMap [#Hashtag] variables for calculating. Further information about *NPGeoMap #Hashtag Variables* see chapter *[fx](/ancoremaps/docs/fx-editor#hashtagvariables)*[-editor](/ancoremaps/docs/fx-editor#hashtagvariables) The whole **PopUp content can be edited with HTML**. With the following feature qvchart you can also display any **Qlik** **object or chart in this PopUp**. Tip: There's a CSS file "info.css" located in the *NPGeoMap Extension Directory* (subfolder "css"), which can be customized to define the **default presentation of PopUps, MouseOver and SketchBoxes**. (If you configure this file make sure to save a backup, when installing an *NPGeoMap* update - the actual file will probably be replaced.) *`This variable used to be called [#SphereRadius] - it was renamed since Isochrones are provided. Former built apps are still compatible! | |
| qvchart Qlik object ID ID of the Qlik object that should be displayed in the PopUp above | Fill in the ID of a Qlik object or chart (see screenshot on the right) to display it in the PopUp defined in the feature above. Basically all Qlik visualizations can be used, however this feature is optimized for displaying Qlik charts. The only condition is that the object has to be in the same Qlik application and it will be displayed in the PopUp the same way and size as it is there. Nonetheless you can put it on a separate work sheet, to get it out of the way. If there are PopUp Variables defined in the Layer Settings and in Qlik, the Qlik chart can also be reduced to their content before. |
Was this article helpful?