| SETTING / VALUES | EXPLANATION |
| |
| Layer | |
| groupname text | assign Layers to groups - use groups for selection and zoom settings |
| opacity number | defines opacity of the whole(!) layer in degrees (0-360), including Images, Labels, Arrows... inside MAP/MARKER/LINE SETTINGS opacity of each record can be set |
| MARKER only scaleonzoom number scalebasezoom number | 0= no scaling, 1-100 = percentage value to increase or decrease Marker size relative to zoom(level) "scaleonzoom": zooming out makes Markers smaller, zooming in makes them bigger "scalebasezoom": zoomlevel on which labels are precisely the size set in MARKER SETTINGS, from this basis on the "scaleonzoom" works |
| excludefromzoom true/false | exclude this particular layer from the automatic zoom/view |
| minzoom number maxzoom number | set a zoomlevel - the whole Layer won't be visible above ("minzoom") or beneath ("maxzoom") (-1= setting disabled) |
| |
| Data | |
| selectable true/false | defines if objects of this layer are selectable |
| MAP and LINE only areacoveredtoselect number | how much of the area of a Polygon or the length of a Line (in %) must be covered for the selection to take effect |
| orderexpression number | objects of this layer will be ordered/sorted according to this setting, if objects overlap, first objects in this order are beneath and last ones on top |
| popupvariable text | Feature for setting Qlik variables for further use in Qlik objects. The variables are filled with a click on an object or a legend segment in NPGeoMap with the respective values. It is used to display any Qlik visualizations in NPGeoMap PopUps or to reduce the data in Qlik objects with a simple click on the map (without taking actual selections). By clicking on an object in NPGeoMap the variable is filled with the respective dimension value. (For example clicking on a Marker fills the variable with it's dimension value.) When clicking on a Radial Sphere or an Isochrone, all values of the Markers or Polygons within this Sphere will be written in the variable. The same goes with clicking on a Legend segment (due to QlikView this option is limited to 20,000 values - no limitation in Qlik Sense). Example Polygon: The map shows the US states and their names are set as Polygon dimension. A click on the state Texas for example now fills the variable with its ID "Texas". Now configured QlikView visualizations are reduced to the value "Texas". If additionally a PopUp is set for this map with the feature "qvchart", the QlikView visualization in the opened PopUp as well is reduced to "Texas". Example Legend: The map from above is now dynamically colored by using Classes, for example from good to bad sales with green-yellow-red. Now a click on the green segment in the legend fills the variable with the dimension values from all green Polygons, like "Texas, California, New York, Florida". A simple click on an object is the trigger for filling the variable. Basically this feature is enabled as soon as the variables are set in the Qlik application as well. Note: Make sure to press F5 for a refresh after setting the variables, in order to let the changes take effect. The best is to use aggregation formulas for limiting the displayed values within Qlik expressions: Sum({<ID = {$(#NPG_MarkerValues)}>} sales) This Example sums up all "sales", where the ID contains the values from the element list of the variable NPG_MarkerValues. You can find more information about this formula in the QlikView Manual in chapter "Set Analysis". In this way Qlik charts and visualizations can be steered by NPGeoMap and displayed in its PopUps. |
| MARKER and LINE only renderemptycoordinates true/false | Faulty Marker or Line coordinates just won't be displayed by default. They are faulty, if either the latitude or the longitude is missing or even both. With this feature you can activate them to be displayed as well. The Marker coordinates will then appear exactly at zero - this is the point on earth, where the Greenwich meridian and the equator meet (located somewhere near the west African coast). Therefore all faulty Marker coordinates can be located easily. Since PopUps automatically sum up Markers that are located exactly at the same point, you can enable them in the settings and then just read out which Markers are affected. |
| MARKER and LINE only proj4definition text | If the Marker coordinates are not in WGS84 format, the actual format can be used by setting the so called "Proj4" code (of respective map projection) here. In this way the Marker coordinates can be used directly in the NPGeoMap object. (This setting takes no effect on Path coordinates.) Example: Marker coordinates are provided in the Lambert format "EPSG:2204" The Proj4 code can be determined via spatialreference.org (see screenshot) and set in this feature like: "proj4definition": "+proj=lcc +lat_1=35.25 +lat_2=36.41666666666666 +lat_0=34.66666666666666 +lon_0=-86 +x_0=609601.2192024384 +y_0=30480.06096012192 +ellps=clrk66 +datum=NAD27 +to_meter=0.3048006096012192 +no_defs" 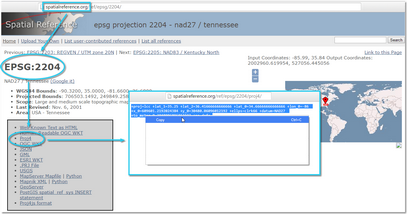 Learn more about Proj4 on the Internet. Learn more about Proj4 on the Internet. |
| Paths maps (MAP and LINE only) path images path | This feature allows to store map or image files in a customized place, even on an external server. Map files in NPGeoMap are loaded from the path you set here. The default map path is "\Extensions\maps". If you use an external server, make sure CORS is set correctly. For Images set a web path/URL or use a folder inside the NPGeoMap image directory: "...QlikView\Extensions\Objects\NPGeoMap_v3\NPGeoMap_v3_Basic\images[yourimagepath]" |
| MAP and LINE only Caching savechachedmapsfromserver true/false maxcachedays number | By default NPGeoMap works with a system that caches the Maps (used in the object) and saves it inside the browser memory. This increases the performance a lot, especially when big map data is used. In case the browser memory on your server is limited and quite small, you may turn off the caching here to save the memory space. This setting may be restricted to a specified duration. After a defined amount of days the Cache will be cleared automatically and all required Maps will be reloaded. If you set it to "0 days", the cache will never be cleared automatically. This means for example if new Map files are available, they should be renamed (versioned) or you have to clear the map cache manually. |
| |
| Format | |
| kpiformat number | default format of KPI values - referes to setting inside MAP/MARKER/LINE SETTINGS comma symbolizes thousands separator, point stands for decimal delimiter and the zeros after the point are the decimal places |
| usemetricunits number | Defines the basically used unit system for calculated numbers (like the displayed numbers in the legend, in selection areas or distance information) in NPGeoMap: 1 = use metric system (default) meters, kilometers 0 = US/UK system (United States customary units/Imperial units) miles, feet |
| unitsFactor number | sets the unit for calculated distances 1= kilometers/miles (default) 0= meters/feet |
| |
| Label | |
| MAP only multipolygon true/false | Labels of Multipolygons can be displayed on the largest/first Polygon of each record (false = default) or on all Polygons (true). If several Polygons have the same ID, they end up to a Multipolygon, e.g. the shape of Italy with Sicilia, Sardegna and some other small islands. |
| MAP and LINE only overflow true/false | true = labels are always visible, even when they overlap the endings of the Line (label longer than line) false = labels are only displayed, when they fit along the Line (when zooming out and Lines are getting too short, labels disappear) |
| font text | set font-size and font-family like in HTML |
| color color | When setting colors you can use Hex-Codes, HTML color names or RGB Example``: color red = #FF0000 or red or RGB(255, 0, 0) (Detailed information in chapter The fx-editor) |
| stroke number | thickness of a stroke around the letters of labels in pixels |
| strokecolor color | When setting colors you can use Hex-Codes, HTML color names or RGB Example``: color red = #FF0000 or red or RGB(255, 0, 0) (Detailed information in chapter The fx-editor) |
| MARKER SETTINGS: markerheading true/false LINE SETTINGS: uselineheading true/false | labels head just like their respective Markers or Lines do (along the Line) |
| labelposition number | centerLeft=1, centerRight=2, centerCenter=3, topLeft=4, topRight=5, topCenter=6, bottomLeft=7, bottomRight=8, bottomCenter=9 |
| labeloffsetx number labeloffsety number | set offset for labels along x-axis in pixels (LINES: the x-axis is always along the Line) |
| scaleonzoom number scalebasezoom number | 0= no scaling, 1-100 = percentage value to increase or decrease label size relative to zoom(level) "scaleonzoom": zooming out makes Markers smaller, zooming in makes them bigger "scalebasezoom": zoomlevel on which labels are precisely the size set in "font", from this basis on the "scaleonzoom" works |
| minzoom number maxzoom number | set a zoomlevel - labels are not visible above ("minzoom") or beneath ("maxzoom") (-1= setting disabled) |
| |
| Image | |
| LINE only imageheading number imageposition number | Images head just like their respective Lines do (along the Line) position on Line: 1 = start/beginning of Line, 2 = center, 3 = end of Line |
| MAP and LINE only scaleonzoom number scalebasezoom number | 0= no scaling, 1-100 = percentage value to increase or decrease image size relative to zoom(level) "scaleonzoom": zooming out makes Images smaller, zooming in makes them bigger "scalebasezoom": zoomlevel on which labels are precisely the size set in MAP/LINES SETTING, from this basis on the "scaleonzoom" works |
| MAP and LINE only minzoom number maxzoom number | set a zoomlevel - Images are not visible above ("minzoom") or beneath ("maxzoom") (-1= setting disabled) |
| chart colors color array stroke number strokecolor color | set default color, stroke thickness and stroke color for Image Charts When setting colors you can use Hex-Codes, HTML color names or RGB Example``: color red = #FF0000 or red or RGB(255, 0, 0) (Detailed information in chapter The fx-editor) |
| |
| Design | |
| MAP only defaultcolors color array | default colors for polygons When setting colors you can use Hex-Codes, HTML color names or RGB Example``: color red = #FF0000 or red or RGB(255, 0, 0) (Detailed information in chapter The fx-editor) |
| selected color color | This color is used as fill color for marked objects while making a selection - this means before you release the control key or confirm in selection menu with the green OK button, selected objects are marked with this color. When selection is done, they turn back to their original color. The feature is meant to use in case if your original color is the same as the selectedpolygoncolor. When setting colors you can use Hex-Codes, HTML color names or RGB Example``: color red = #FF0000 or red or RGB(255, 0, 0) (Detailed information in chapter The fx-editor) |
| highlight active true/false stroke (MAP only) number color color | Enables or disables an effect which highlights dynamic objects when the cursor hovers on them. Hexagons respond to that feature as well (because technically they are also Polygons). This is especially very useful when Legends are configured - if the cursor hovers on a Legend segment, all objects referring to that segment are highlighted. 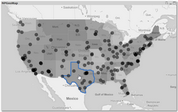 In case the color of the highlight is to similar to the object color (or the same), the highlight color can be set as well - even to get a better contrast. When setting colors you can use Hex-Codes, HTML color names or RGB In case the color of the highlight is to similar to the object color (or the same), the highlight color can be set as well - even to get a better contrast. When setting colors you can use Hex-Codes, HTML color names or RGB Example``: color red = #FF0000 or red or RGB(255, 0, 0) (Detailed information in chapter The fx-editor) |
| |
| Heatmap | MARKER SETTINGS only |
| gradient color array blur number radius number | enable Heatmap by setting Marker "Type" = 7 inside MARKER SETTINGS "gradient": set the colors for a Heatmap melting default color array: ["#00f", "#00f", "#0f0", "#ff0", "#f00"], "blur": set color gradient intensity of the Heatpoints "radius": size of Heatpoints in pixels the size set inside MARKER SETTINGS defines the weighting/intensity of each Heatpoint 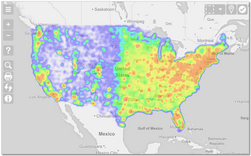 |
| |
| Cluster | MARKER SETTINGS only basic settings for Circle and Hexagon Grid Cluster - set colors and sizes inside CLASS SETTINGS |
| type number | set kind of Cluster: 0 = no Cluster 1 = Circle Cluster 2 = Hexagon Grid Cluster |
| circle distance number threshold number qvchart qlik object ID popup content tooltip content label content opacity number bordercolor color borderwidth number colorsource number sizesource number colorexpression calculation formula sizeexpression calculation formula | set circle cluster 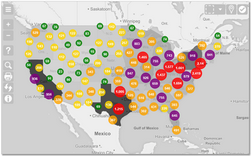 "distance": maximum radius of the area of a Cluster Marker - Markers within this distance will be summed up keep in mind that this setting is given in pixels, hence the calculation changes in relation to the zoom level "threshold": minimum amount of Markers within the defined Cluster distance, to basically create a Cluster Marker if there are less, Markers are just displayed as set inside MARKER SETTINGS "qvchart": set a QlikView Object ID e.g. "CH01" - you can use all QlikView visualizations to display them in the Popup (original size) use "popupvariable" inside LAYER SETTINGS to restrict the QlikView visualization to the values of the variables, like for example the current selection more information on setting qvcharts in MARKER SETTINGS "popup": information displayed when clicking on Cluster Marker - you can use several NPGeoMap [#Hashtag] variables in here: [#Info] [#Count] [#Distance] [#Units] [#KPI] (as well as all custom KPI variables, e.g. [#KPIyourname]) more information on setting popups in MARKER SETTINGS "tooltip": information displayed when cursor hovers over Cluster Marker - you can use several NPGeoMap [#Hashtag] variables in here: [#Info] [#Count] [#Distance] [#Units] [#KPI] (as well as all custom KPI variables, e.g. [#KPIyourname]) more information on setting tooltips in MARKER SETTINGS "label": label displayed on center of Cluster Marker - you can use several NPGeoMap [#Hashtag] variables in here: [#Info] [#Count] [#Distance] [#Units] [#KPI] (as well as all custom KPI variables, e.g. [#KPIyourname]) "opacity": opacity of the fill color in % "bordercolor": border color When setting colors you can use Hex-Codes, HTML color names or RGB "distance": maximum radius of the area of a Cluster Marker - Markers within this distance will be summed up keep in mind that this setting is given in pixels, hence the calculation changes in relation to the zoom level "threshold": minimum amount of Markers within the defined Cluster distance, to basically create a Cluster Marker if there are less, Markers are just displayed as set inside MARKER SETTINGS "qvchart": set a QlikView Object ID e.g. "CH01" - you can use all QlikView visualizations to display them in the Popup (original size) use "popupvariable" inside LAYER SETTINGS to restrict the QlikView visualization to the values of the variables, like for example the current selection more information on setting qvcharts in MARKER SETTINGS "popup": information displayed when clicking on Cluster Marker - you can use several NPGeoMap [#Hashtag] variables in here: [#Info] [#Count] [#Distance] [#Units] [#KPI] (as well as all custom KPI variables, e.g. [#KPIyourname]) more information on setting popups in MARKER SETTINGS "tooltip": information displayed when cursor hovers over Cluster Marker - you can use several NPGeoMap [#Hashtag] variables in here: [#Info] [#Count] [#Distance] [#Units] [#KPI] (as well as all custom KPI variables, e.g. [#KPIyourname]) more information on setting tooltips in MARKER SETTINGS "label": label displayed on center of Cluster Marker - you can use several NPGeoMap [#Hashtag] variables in here: [#Info] [#Count] [#Distance] [#Units] [#KPI] (as well as all custom KPI variables, e.g. [#KPIyourname]) "opacity": opacity of the fill color in % "bordercolor": border color When setting colors you can use Hex-Codes, HTML color names or RGB Example``: color red = #FF0000 or red or RGB(255, 0, 0) (Detailed information in chapter The fx-editor) "borderwidth": thickness of border in pixels "colorsource" and "sizesource": define if Cluster colors/sizes are calculated based on the amount of Markers or on their respective number values (set inside MARKER SETTINGS "Color%", "Size%" or "KPI") 0 = automatic (if available KPI values, else Color values, else amount of Markers) 1 = amount of Markers 2 = number values of Color% settings 3 = number values of KPI settings 4 = number values of Image% setting (colorsource) or Size% setting (sizesource) "colorexpression" and "sizeexpression": enhanced setting for color and size source of Circle Cluster Markers, expression must be in curly brackets {} - e.g: "{[#KPI]/[#Count]}" use only numbers and numeric NPGeoMap [#Hashtag] variables NOTE: these two expression settings REPLACE the settings for "colorsource" and "sizesource" - if you want to use simple source settings again, either empty expression settings or remark them |
| hexagon caption text showmarker true/false radius number qvchart qlik object ID popup content tooltip content label text opacity number bordercolor color borderwidth number colorsource number colorexpression calculation formula | "radius": radius of a Hexagon in kilometers/miles (set inside "unitsFactor") !Important: since maps are always a distortion of a 3D globe though the Hexagon Grid is displayed evenly over the 2D map, all the Hexagons can't have the exact same "real" distances! therefore use the NPGeoMap Hashtag variable [#Distance] (showing the actual distance of each Hexagon) to avoid false or inaccurate assumptions "qvchart": set a QlikView Object ID e.g. "CH01" - you can use all QlikView visualizations to display them in the Popup (original size) use "popupvariable" inside LAYER SETTINGS to restrict the QlikView visualization to the values of the variables, like for example the current selection more information on setting qvcharts in MARKER SETTINGS "popup": information displayed when clicking on Cluster Marker - you can use several NPGeoMap [#Hashtag] variables in here: [#Info] [#Count] [#Distance] [#Units] [#KPI] (as well as all custom KPI variables, e.g. [#KPIyourname]) more information on setting popups in MARKER SETTINGS "tooltip": information displayed when cursor hovers over Cluster Marker - you can use several NPGeoMap [#Hashtag] variables in here: [#Info] [#Count] [#Distance] [#Units] [#KPI] (as well as all custom KPI variables, e.g. [#KPIyourname]) more information on setting tooltips in MARKER SETTINGS "label": label displayed on center of Cluster Marker - you can use several NPGeoMap [#Hashtag] variables in here: [#Info] [#Count] [#Distance] [#Units] [#KPI] (as well as all custom KPI variables, e.g. [#KPIyourname]) "opacity": opacity of the fill color in % "bordercolor": border color When setting colors you can use Hex-Codes, HTML color names or RGB Example``: color red = #FF0000 or red or RGB(255, 0, 0) (Detailed information in chapter The fx-editor) "borderwidth": thickness of border in pixels "colorsource": defines if Cluster colors are calculated based on the amount of Markers or on their respective number values (set inside MARKER SETTINGS "Color%" or "KPI") 0 = automatic (if available KPI values, else Color values, else amount of Markers) 1 = amount of Markers 2 = number values of Color% settings 3 = number values of KPI settings "colorexpression": enhanced setting for color source of Hexagons, expression must be in curly brackets {} - e.g: "{[#KPI]/[#Count]}" use only numbers and numeric NPGeoMap [#Hashtag] variables NOTE: "colorexpression" setting REPLACES the "colorsource" setting - if you want to use simple source setting again, either empty expression setting or remark it |
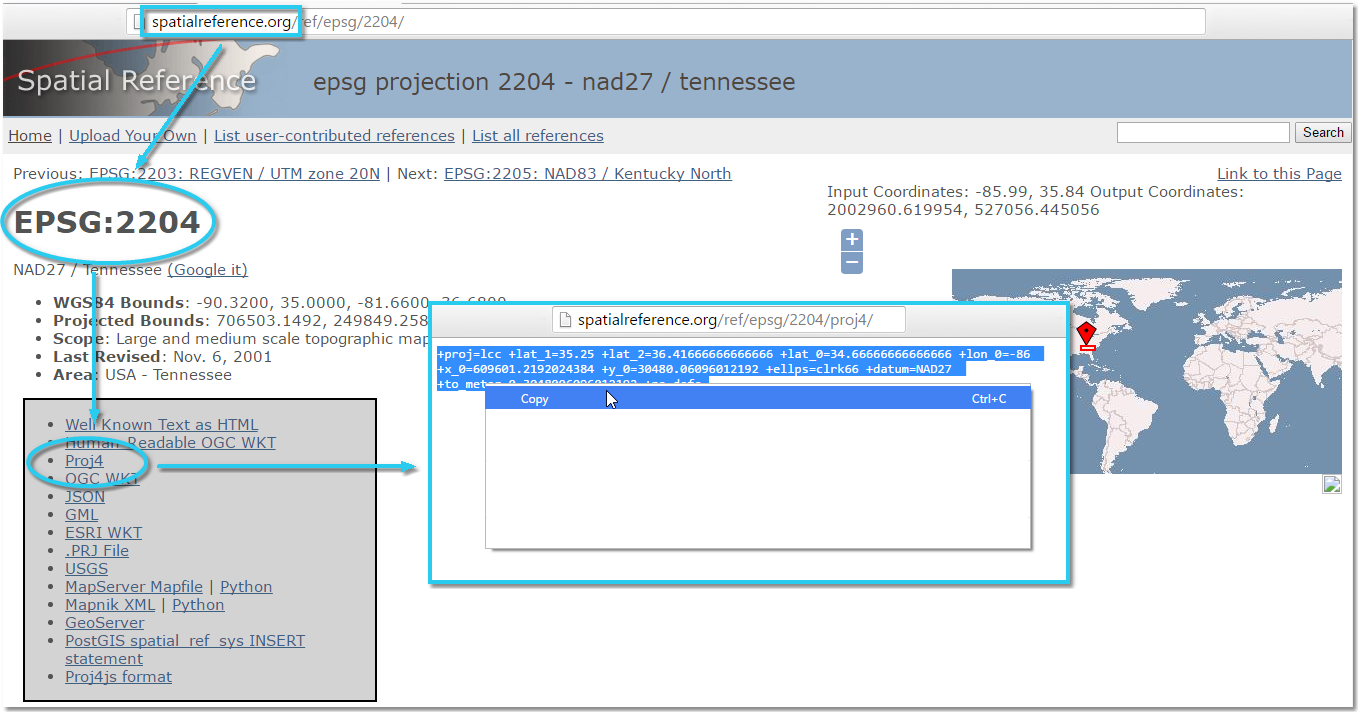 Learn more about Proj4 on the Internet.
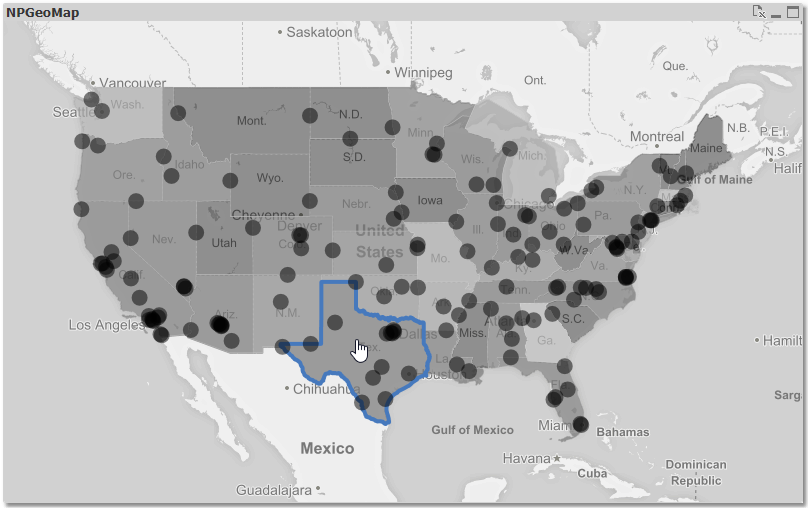 In case the color of the highlight is to similar to the object color (or the same), the highlight color can be set as well - even to get a better contrast. When setting colors you can use Hex-Codes, HTML color names or RGB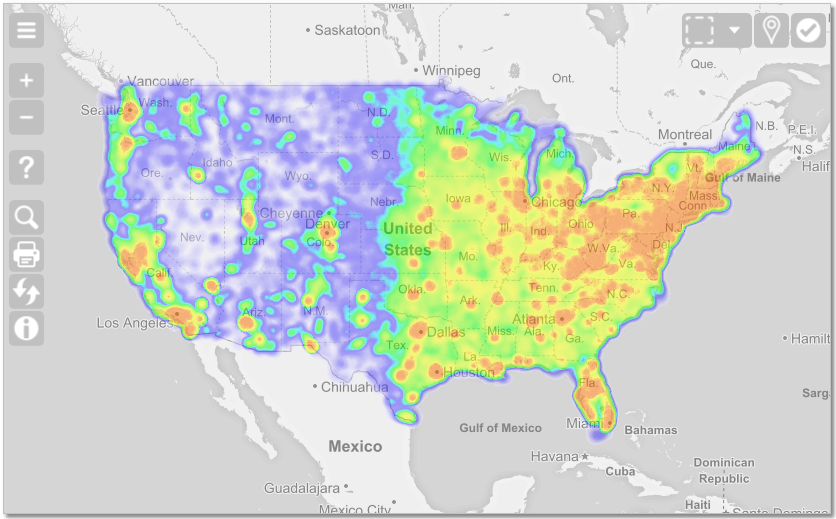
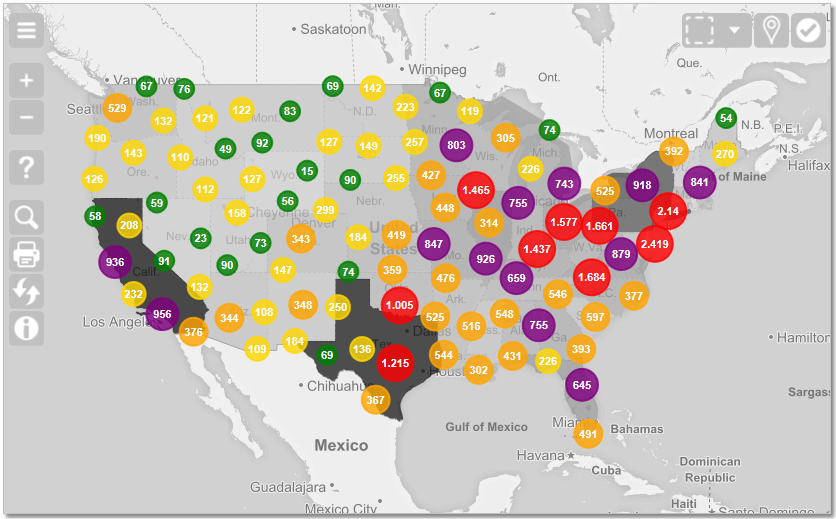 "distance": maximum radius of the area of a Cluster Marker - Markers within this distance will be summed up keep in mind that this setting is given in pixels, hence the calculation changes in relation to the zoom level "threshold": minimum amount of Markers within the defined Cluster distance, to basically create a Cluster Marker if there are less, Markers are just displayed as set inside MARKER SETTINGS "qvchart": set a QlikView Object ID e.g. "CH01" - you can use all QlikView visualizations to display them in the Popup (original size) use "popupvariable" inside LAYER SETTINGS to restrict the QlikView visualization to the values of the variables, like for example the current selection more information on setting qvcharts in MARKER SETTINGS "popup": information displayed when clicking on Cluster Marker - you can use several NPGeoMap [#Hashtag] variables in here: [#Info] [#Count] [#Distance] [#Units] [#KPI] (as well as all custom KPI variables, e.g. [#KPIyourname]) more information on setting popups in MARKER SETTINGS "tooltip": information displayed when cursor hovers over Cluster Marker - you can use several NPGeoMap [#Hashtag] variables in here: [#Info] [#Count] [#Distance] [#Units] [#KPI] (as well as all custom KPI variables, e.g. [#KPIyourname]) more information on setting tooltips in MARKER SETTINGS "label": label displayed on center of Cluster Marker - you can use several NPGeoMap [#Hashtag] variables in here: [#Info] [#Count] [#Distance] [#Units] [#KPI] (as well as all custom KPI variables, e.g. [#KPIyourname]) "opacity": opacity of the fill color in % "bordercolor": border color When setting colors you can use Hex-Codes, HTML color names or RGB