Map, Marker and Line Settings
| This topic describes all the dynamic settings of the Data Layer. That means every setting of this dialog is calculated for each dimension record. Basically the settings are the same for all objects - MAP (Polygons), MARKERS (Points) and LINES (or Paths) - specific differences are indicated below. Condition Condition for calculating the Layer. Coordinates Setting coordinates for Polygons, Points or Lines/Paths. SETTINGS Dynamic settings for Polygons, Markers and Lines - all calculated for each dimension record: Type (for MARKER and LINE only) Heading (for MARKER only) Style (for LINE only) LineBend (for LINE only) Color Color% Pattern (for MAP only) Opacity Size or Width (for MARKER and LINE only) Size% or Width% (for MARKER and LINE only) BorderColor (for MARKER and MAP only) BorderColor% (for MARKER only) BorderSize (for MARKER and MAP only) BorderSize% (for MARKER only) Label LabelPosition Tooltip Popup Qvchart Image Image% ImageChart ImageSize (for MAP only) ImageSize% (for MAP only) ImageOpacity (for MAP only) ImageHeading (for MAP and LINE only) ImagePosition (for LINE only) Metadata - Info and KPI Set Data here (Info in text format, KPI in number format), which you can use elsewhere (e.g. in Tooltips or Popups) |
| Note: The values for nearly all features may be entered as calculated formulas or variables. |
| For detailed information about notation in this dialogs go to chapter The fx-editor. |
| MAP / MARKER / LINE SETTINGS | |||
|---|---|---|---|
| SETTING / VALUES | EXPLANATION | ||
| Condition | |||
| if(1=1, [settings] ) | Condition for calculating the Layer/record. This is a simple Qlik formula, which encloses all the settings in the dialog. Replace "1=1" by any expression, eg.: sum(Sales) > 500 (The bracket of this formula closes after the list of Settings, before an eventual description/notes) | ||
| COORDINATES | Set coordinates for Polygons, Markers or Lines. | ||
| MAP Coordinates Coordinates multiple coordinates | Polygon Coordinates in WGS84 projection format, using: Encoded Polylines: 'm{hHodMvnsr@zqrc@_heHa}{aB' more details see developers.google.com GeoJSON MultiPoligons (KML): '[[[[2.370801,48.898192],[-3.737597,40.385331],[12.434278,41.842014]]]]' file name (file stored within NPGeoMap extension directory, subfolder "maps"): 'yourfilename.NPGP' (contains Encoded Polylines) or 'yourfilename.NPGM' (contains Lat/Lon separated with space and pipe) Access to all NPGeoMap Map files: https://s3.eu-central-1.amazonaws.com/npgeomap/maps | ||
| MARKER Coordinates Marker single coordinates | Coordinates in WGS84 projection format, using: Latitude, Longitude (SinglePoint) '48.140839, 16.386138' GeoJSON Points (KML) '[13.051369,47.802554]' MultiPoints Several Markers with different Coordinates, but the same ID '48.139694,16.382490;47.802554,13.051369' | ||
| LINE Coordinates Start single coordinates End single coordinates Path multiple coordinates | "Start" and "End" of a Line Coordinates in WGS84 projection format for Start and End of Lines, using: Latitude, Longitude (SinglePoint): '48.140839, 16.386138' GeoJSON Points (KML): '[13.051369,47.802554]' The system always connects a Marker with a Endmarker, in the order they are loaded - the first coordinates of "Start" with the first coordinates of "End", then the second coordinates of "Start" with the second coordinates of "End", and so on. Therefore, if you want to create a one-to-many connection (or many-to-one), just set the same coordinates in "Start" (or "End"). If there is not the same number of coordinate points in "Start" and "End", the surplus coordinates are displayed as simple points. Path Coordinates Path Coordinates in WGS84 projection format (3 or more points in a row), using: Latitude, Longitude (separated with comma and semicolon): '48.898192,2.370801;40.385331,-3.737597;41.842014,12.434278' Latitude, Longitude (separated with space and pipe): '48.898192 2.370801 | 40.385331 -3.737597 | 41.842014 12.434278' GeoJSON MultiPoints (KML): '[[[2.370801,48.898192],[-3.737597,40.385331],[12.434278,41.842014]]]' Encoded Polylines: 'm{hHodMvnsr@zqrc@_heHa}{aB' file name (file stored within NPGeoMap extension directory, subfolder "maps"): 'yourfilename.NPGP' (contains Encoded Polylines) or 'yourfilename.NPGM' (contains Lat/Lon separated with space and pipe) Several Path sections are separated by hash "#". 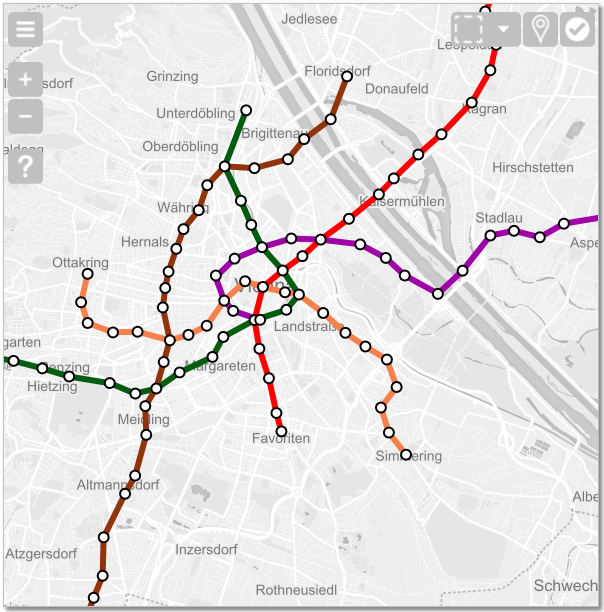 |
| MARKER SETTINGS | In this section there are all features for setting functionality and presentation (Labels, PopUps, MouseOvers/Tooltips,...) of Markers. | ||
| MARKER and LINE only Type number | MARKER SETTINGS: Set the Marker type/shape in which Markers are displayed: 0 = don't show Markers 1 = don't show Markers, but the Label 2 = circle (default) 3 = triangle 4 = square 5 = pentagon 6 = hexagon 7 = Heatpoint for Heatmaps You can also display an Image or a small ImageChart INSTEAD of a shape - settings further below. Performance tip: Circles need the least rendering time. If you have many Markers, Type 2 is the fastest at loading. LINE SETTINGS: Line types: 0 = no Line 1 = Path or straight Line (default) 2 = GreatCircle (beeline/linear distance) 4 = Curved Line - Beatle (Bézier with one curve) 5 = Curved Line - Swing (Bézier with two curves) 6 = Curved Line - Bending Line (customizable bending angle) A GreatCircle is the geographically shortest connection between two points. Due to perspective distortion (because of projecting the 3D globe on a 2D map), this line may look like a curve, depending on the position and the projection type. Nonetheless it is the correct course. Therefore this Line type is best for displaying airlines and flight routes. Curved Lines are a visual alternative to straight lines. In some cases they may look better than straight Lines. The Line type Beatle is for instance best for displaying global interaction and cash flow. Swing Lines are a good choice to connect for instance Customers and Branches. Bending Lines are the most flexible ones, as their bending angle can be freely adjusted - see setting "LineBend". | ||
GreatCircles: type = 2 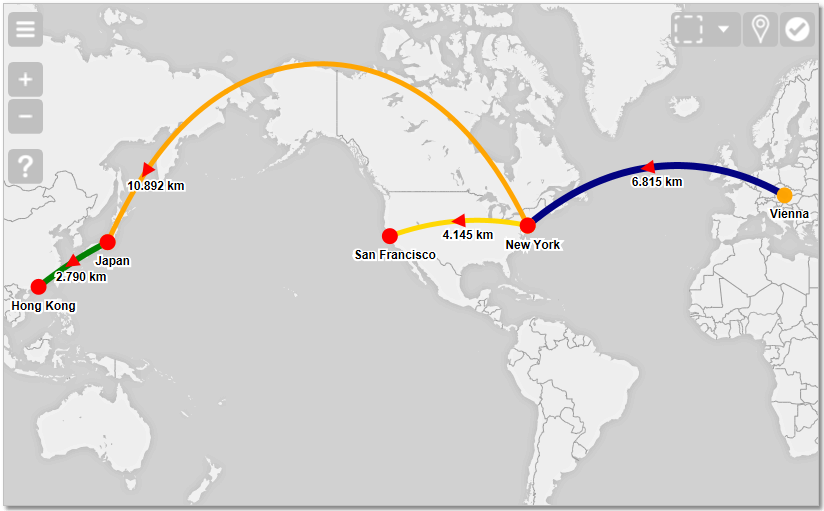 | Curved Lines: 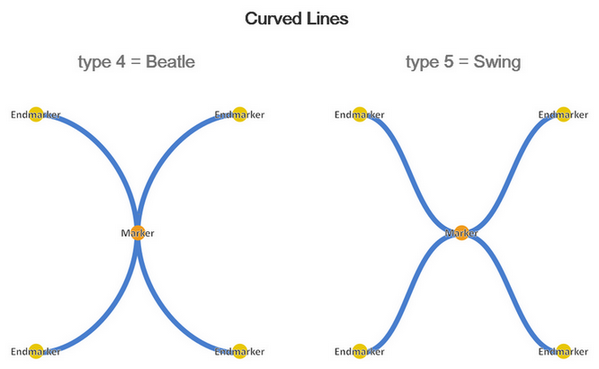 | ||
Beatle Lines: type = 4 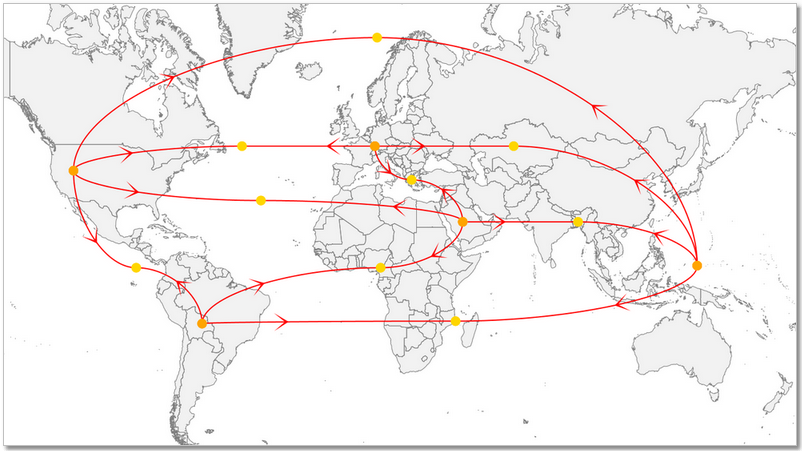 | Swing Lines: type = 5 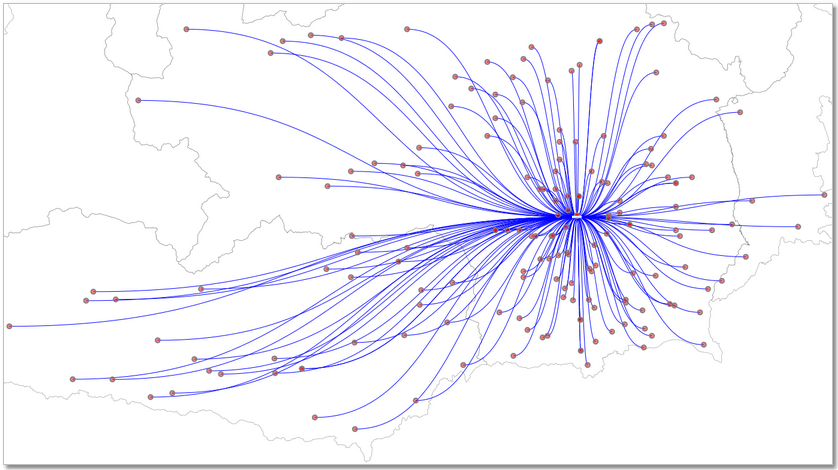 | Bending Lines: type = 6 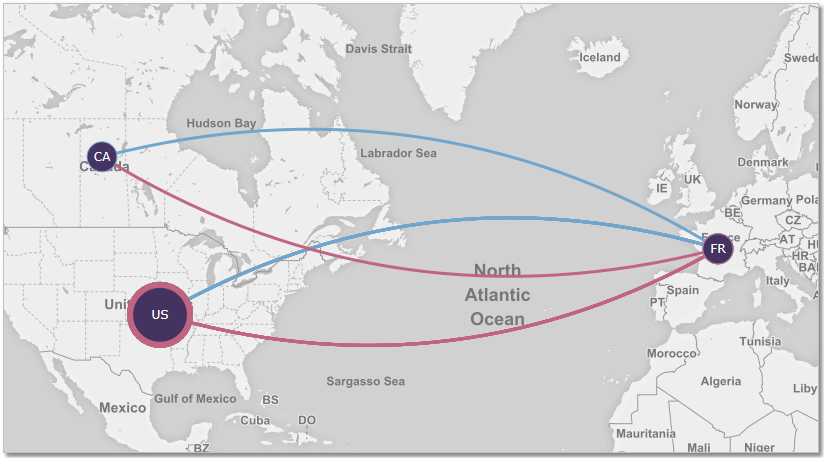 | |
| MARKER only Heading number | Marker heading 0-360 (degrees), e.g.: (180-(1.8*(sum(SALES)/(max(TOTAL SALES)/100))) | ||
| LINE only Style parameter | Line/Path style: solid dot dash dashdot longdash longdashdot |  | |
| LINE only LineBend number | This feature can only be used with Line Type 6 - Bending Lines. The bending angle of these Lines can be customized here in degrees - positive values always bend clockwise (mind the direction and orientation of your Line from Startmarker to Endmarker), negative values counterclockwise. (An angle with 0° would be a straight Line.) 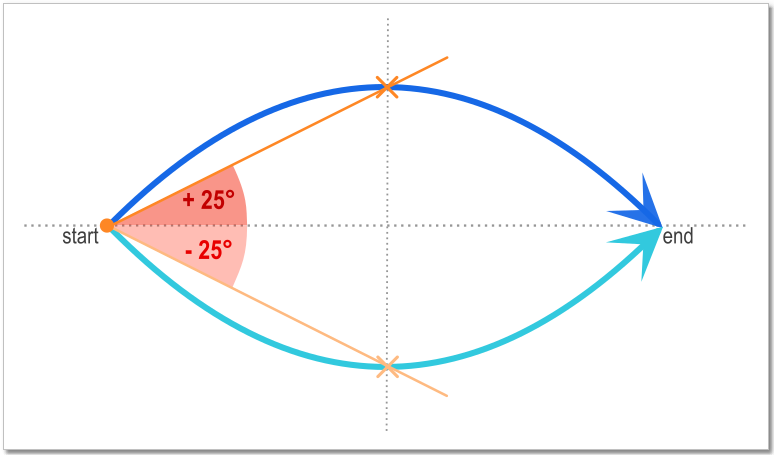 | ||
| Color color | Marker fill color. When setting colors you can use Hex-Codes, HTML color names or RGB Example``: color red = #FF0000 or red or RGB(255, 0, 0) (Detailed information in chapter The fx-editor) | ||
| Color% number | Set here a KPI or other number values (for example Sum(Sales)) instead of a color/size/image value, to determine the colors/sizes/images with Classes. The Classes are configured in the fx-editor SCALE CLASSES. | ||
| MAP only Pattern parameters | Polygon fill pattern Parameters (all separated by pipe" | "): pattern type (line, dot, circle, tile, square - or one from the list below) color (or "false" for using Polygon color) opacity (0-100 percent) size (px) spacing (px) angle (0-180 degrees) **Example: 'line | red |
| Opacity number | Opacity of the fill color in percent: 0% - colors are covering 100% - completely transparent | ||
| MARKER SETTINGS: Size number LINE SETTINGS: Width number | MARKER SETTINGS: Radius of Markers or Images. For example radius is set to 5px - Images will be rendered in 10px width (the relative height is calculated automatically). If Heatmap is enabled (type=7) size values define the weighting/intensity of each Heatpoint. LINE SETTINGS: Line width in pixels. | ||
| MARKER SETTINGS: Size% number LINE SETTINGS: Width number | Set here a KPI or other number values (for example Sum(Sales)) instead of a color/size/image value, to determine the colors/sizes/images with Classes. The Classes are configured in the fx-editor SCALE CLASSES. | ||
| MAP and MARKER only BorderColor color | Border color of Polygons or Markers. If you don's set any value here, no border will be rendered. When setting colors you can use Hex-Codes, HTML color names or RGB Example``: color red = #FF0000 or red or RGB(255, 0, 0) (Detailed information in chapter The fx-editor) | ||
| MARKER only BorderColor% number | Set here a KPI or other number values (for example Sum(Sales)) instead of a color/size/image value, to determine the colors/sizes/images with Classes. The Classes are configured in the fx-editor SCALE CLASSES. | ||
| MAP and MARKER only BorderSize number | Border size/width in pixels. | ||
| MARKER only BorderSize% number | Set here a KPI or other number values (for example Sum(Sales)) instead of a color/size/image value, to determine the colors/sizes/images with Classes. The Classes are configured in the fx-editor SCALE CLASSES. | ||
| Label content | Set Labels for Polygons, Markers or Lines. Basically labels contain only text, but you can use variables and formulas. Labels can be edited with line breaks (using Chr(13)), but it's not possible to use HTML here. | ||
| LabelPosition parameter | Label position, relativ to the object center. The "centercenter" position for Polygon Labels is calculated by an algorithm, to determine where the biggest space inside the Polygon is. | ||
| Parameters: tl = top left tr = top right bl = bottom left br = bottom right cl = center left cr = center right ct = center top cb = center bottom cc = center center | 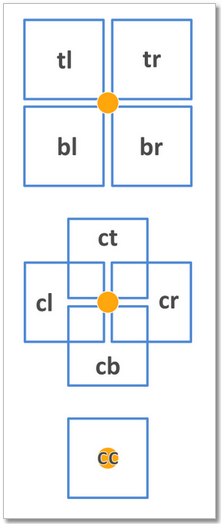 | ||
| Tooltip content | Tooltip (or mouseover) for Polygons, Markers or Lines. It appears next to the mouse cursor, if it hovers over an object. This text may contain HTML, like for example a tag to set a line break. Furthermore a delay and the duration time of MouseOvers can be configured in the Expert Settings. | 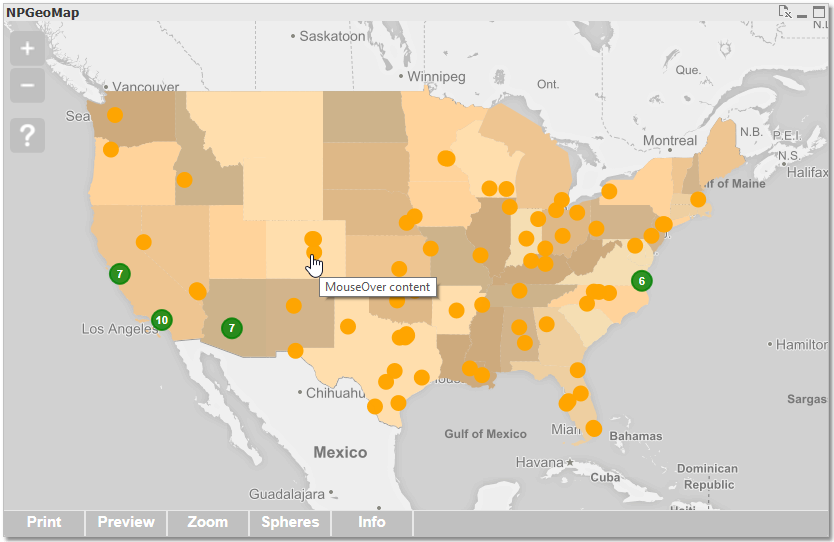 | |
Use Qlik variables, fields and formulas for dynamic content. Example: & '#Tooltip=' & 'Hello World' Example with dynamic content (see sceenshot on the right): & '#Tooltip=' & CustomerName & ' from ' & Customerlocation & ',Sales: ' & Money(CustomerTurnover)  Important: If you want to use local image files in HTML, you have to indicate the following Qlik image path: Qlik Sense: Important: If you want to use local image files in HTML, you have to indicate the following Qlik image path: Qlik Sense: ../``Extensions/NPGeoMapSense_v3/images/[...] Example with image: & '#Tooltip=' & ' content ' QlikView:  /QvAjaxZfc/QvsViewClient.aspx?public=only&name=Extensions/NPGeoMap_v3/NPGeoMap_v3_Basic/images/[...] Example with image: & '#Tooltip=' & ' content ' You can copy-paste this example to try it yourself! You can use several NPGeoMap [#Hashtag] variables in here:  [#Info] [#Count] [#KPI] (as well as all custom KPI variables, e.g. [#KPIyourname]) "Info" and "KPI" are set at the end of this dialog. Example: & '#Tooltip=' & 'Sales: [#KPIsales]' More information about integrating Qlik fields or formulas and further details on notation see chapter fx-editor. | |||
| Popup content | A PopUp is a kind of dialog or a small window, that opens or "pops up" if you click on a dynamic object (Polygon, Marker, Line). NPGeoMap can display text and dynamic content in a PopUp. The whole PopUp content can be edited with HTML. Further below in Qvchart you can also add Charts or any other Qlik visualizations to your Popup content. The content you add at this point will appear just above the chart. | 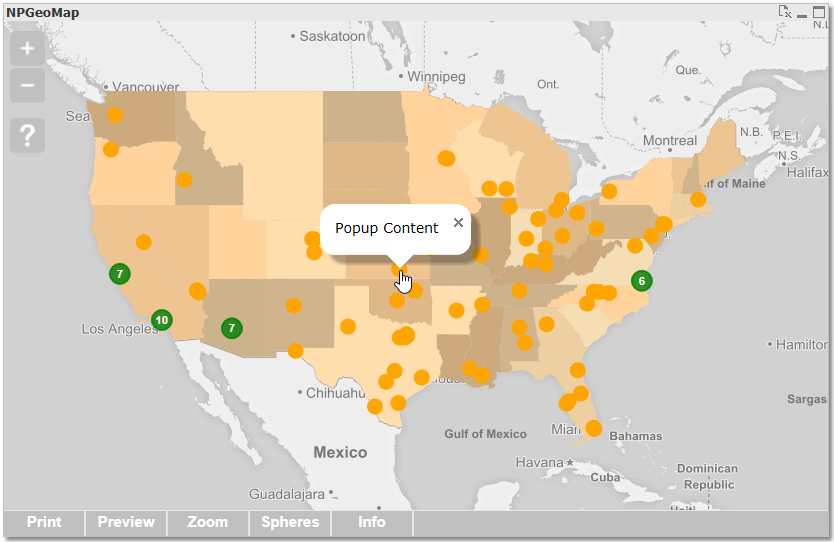 | |
Important: If you want to use local image files in HTML, you have to indicate the following Qlik image path: Qlik Sense: ../``Extensions/NPGeoMapSense_v3/images/[...] Example with image: & '#Popup=' & ' content ' QlikView: /QvAjaxZfc/QvsViewClient.aspx?public=only&name=Extensions/NPGeoMap_v3/NPGeoMap_v3_Basic/images/[...] Example with image: & '#Popup=' & ' content ' You can copy-paste this example to try it yourself!! You can use several NPGeoMap [#Hashtag] variables in here: [#Info] [#Count] [#KPI] (as well as all custom KPI variables, e.g. [#KPIyourname]) "Info" and "KPI" are set at the end of this dialog. Example: & '#Popup=' & 'Sales: [#KPIsales]' The following NPGeoMap #Hashtag Variables are provided, for additional information about the coordinates: [#Latitude] (WGS84 Latitude coordinate) [#Longitude] (WGS84 Longitude coordinate) [#PRJ=EPSG:xxx] (converts the variables above by provided EPSG Code) Example: simple: & '#Popup=' & '[#Latitude] / [#Longitude]' converted: & '#Popup=' & '[#Latitude] / [#Longitude] [#PRJ=EPSG:31252]' integrating GoogleMaps Streetview``: & '#Popup=' & '<iframe width=600 height=450 frameborder=0 style=border:0 src=https://www.google.com/maps/embed/v1/streetview?key=[yourGoogleMapsKey]&location=[#Latitude],[#Longitude]&heading=0&pitch=10&fov=35 allowfullscreen>' More information about integrating Qlik fields or formulas and further details on notation see chapter fx-editor. | |||
| Qvchart Qlik object ID | Feature for displaying any Qlik visualizations in a PopUp. Just fill in the Qlik object ID of the visualization you want to use. Basically all kinds of Qlik objects can be used, however this feature is optimized for displaying Qlik Charts. By using the PopUp Variables inside LAYER SETTINGS, the Qlik visualization can be restricted to the values of the variables, like for example the current selections. QlikView: When using QlikView, the Qlik object has to be on the same sheet, as the NPGeoMap object referring to it. However, you can hide it behind another object on the sheet. The chart will be displayed in the Popup with the exact measures as the object itself. Qlik Sense: If you are using Qlik Sense, see here a description in the Qlik Manual about how to get the object ID in Sense: help.qlik.com/obtain-app-object-id | 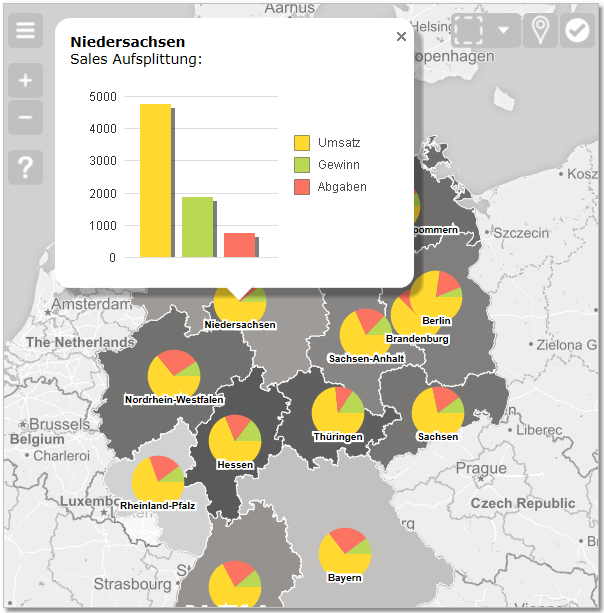 | |
| Image file path or SVG | Set Image. Displayed on a Polygon, as a Marker or on a Line. Just set the file path of the image you want to use. (Marker and Line "Type" needs to be set on "2") The image file itself has to be stored within the NPGeoMap Extension Directory in the sub folder "images" or below. Example (file in folder "image"): & '#Image=' & 'flag.png' Example (file in sub folder "demo"): & '#Image=' & 'demo/airplane.png' Example (screenshot): & '#Image=' & 'office_11.png' You can copy-paste the examples to try it yourself! Tip: It's possible to use animated GIFs. SVG images: Instead of setting an image file you can use SVG to draw a image on the fly. In this way you can use Qlik Fields, Formulas and Variables to draw images with dynamic content. SVG defines vector-based graphics in XML format using the following basic structure: <svg width="30" height="30" xmlns="http://www.w3.org/2000/svg" version="1.1"> ... Just replace width and height by your needed sizes and add svg components like: circles, polygons, text... Read more about SVG at w3schools.com/graphics/svg_intro. | image file: 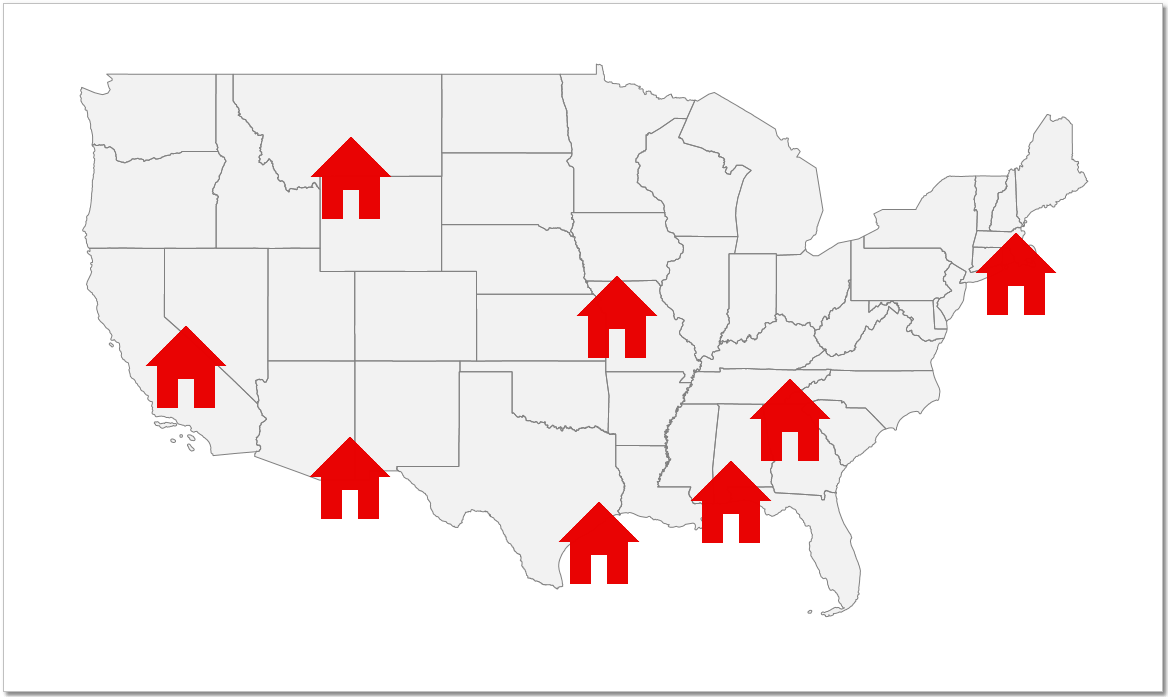 SVG image: SVG image: 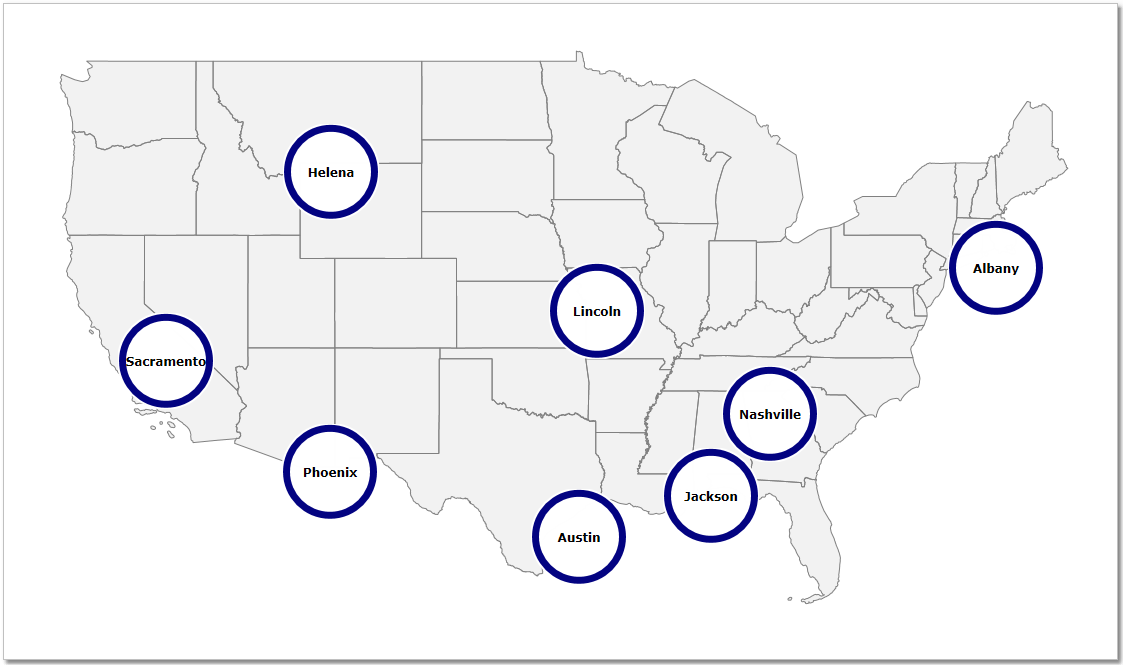 | |
Note: It is important to include the "xmlns" attribute, "width" and "height" and optionally in addition the "version". Example circle: & '#Image=' & '' Example polygon: & '#Image=' & '' Example with dynamic content (screenshot): & '#Image=' & 'Capital &' ' You can copy-paste this example to try it yourself - just replace the Qlik field "Capital" by a existing one. | |||
| Image% content | Set here a KPI or other number values (for example Sum(Sales)) instead of a color/size/image value, to determine the colors/sizes/images with Classes. The Classes are configured in the fx-editor SCALE CLASSES. | ||
| ImageChart Type number Data number BorderSize number BorderColor color Color color Label text | Instead of an Image, an Image Chart can be displayed. "Type" Set the ImageChart type: 0 = no Chart 1 = Pie 2 = Doughnut 3 = Bar | example for ImageChart type Pie: 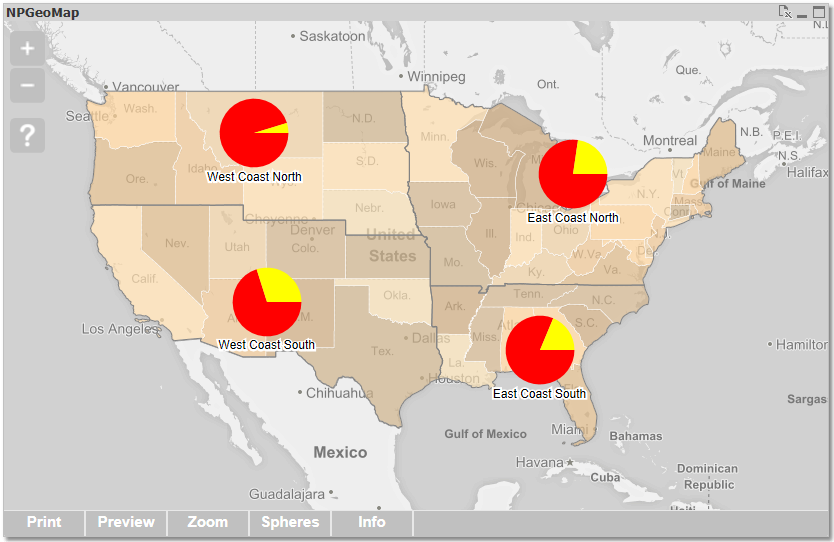 | |
| "Data" The data has to be separated by a vertical bar/pipe character* | . In order to get data from QlikView already pipe seperated, you can use the Concat() function: Concat(Aggr(sum(Sales),ID, Month),' | ',Month) Concat(DISTINCT Month, ' | ', Month) "BorderSize" and "BorderColor" If you don't fill anything in here or remark the line, no border will be displayed. BorderSize is in Pixels. When setting colors you can use Hex-Codes, HTML color names or RGB Example``: color red = #FF0000 or red or RGB(255, 0, 0) (Detailed information in chapter The fx-editor) "Color" If you don't fill anything in here or remark the line, the ImageChart will be displayed in default colors. When there is more data set than colors in this feature, first it goes on with the default colors and then they all will be repeated. The data has to be separated by a vertical bar/pipe character* |
| MAP only ImageSize content | Image size in pixels. To set the size of Images for MARKERS and LINES, use the setting "Size"/"Width". | ||
| MAP only ImageSize% content | Set here a KPI or other number values (for example Sum(Sales)) instead of a color/size/image value, to determine the colors/sizes/images with Classes. The Classes are configured in the fx-editor SCALE CLASSES. To set the size Class of Images for MARKERS and LINES, use the setting "Size%"/"Width%". | ||
| MAP only ImageOpacity content | Opacity of the fill color in percent: 0% - colors are covering 100% - completely transparent | ||
| MAP and LINE only ImageHeading content | Image heading 0-360 (degrees), e.g.: (180-(1.8*(sum(SALES)/(max(TOTAL SALES)/100))) | ||
| LINE only ImagePosition content | Set position of the image along the Line: 1 = start/beginning of Line 2 = center 3 = end of Line | ||
| Metadata - Info and KPI | |||
| Info text KPI number | Set metadata here, to use it for example in Tooltips or Popups. "Info": Text content - values get CONCATENATED, when items are overlapping or summed up in Cluster (only Markers) or Spheres "KPI": Numeric content - values are ADDED UP, when items are overlapping or summed up in Cluster (only Markers) or Spheres Create several custom KPI variables, for example: & '#KPIsales=' & sum(Sales) & '#KPIprofit=' & sum(Profit) Always start with a hash "#" and "KPI" and add a custom name. Use it then like other NPGeoMap [#Hashtag] variables*, for example in Popups: & '#Popup=' & 'Sales: [#KPIsales]' *Use the following NPGeoMap [#Hashtag] variables to display the content elsewhere: [#KPI] - cumulative KPI amount (as well as all your custom KPI variables, e.g. [#KPIyourname]) [#Info] - cumulative Info values (separated by line breaks) [#Count] - amount of records Those variables can be used inside Tooltip and Popup of this dialog Tooltip, Popup and Labels of Cluster Settings (Markers only - set inside LAYER SETTINGS) Tooltip and Popup of RADIAL SPHERES SETTINGS (QlikView: Map Layer) |
Was this article helpful?