Scale Classes
| Classes can automatically determine colors and sizes for objects, based on your KPIs. Easy, simple and fast. The fx-Dialog is structured as follows: Legend Legend configurations like size, fonts or background Objects definition of which classes to use for Polygons (colors) and Markers (colors and sizes) Classes detailed class settings like design, colors, sizes, mode/type (read more below), respective Legend presentation,... |
Classes assign number values (KPIs) to appropriate group values (e.g. a Marker size group) or gradient/course values (e.g. a color gradient) - like each sale a Polygon color or each amount a Marker size. Instead of using complex formulas to determine relating colors or sizes, it suffices to set a number value (KPI) inside MAP/MARKER/LINES SETTINGS - all settings that end on "%".
Common color assignment by using if-formulas:
& '#Color=' & if(sum(Sales)<100000, 'red', if(sum(Sales)<200000, 'orange', if(sum(Sales)<400000, 'yellow', 'green')))
Class based color assignment with Color%``:
& '#Color%=' & sum(Sales)
Class based size assignment with Size%``:
& '#Size%=' & sum(Sales)
Note: The Classes in this fx-editor can be used as templates - you can copy and configure them as needed.
| The Classes | ||||
| class type/ mode | type = 1 or type = 2 EVEN GRADIENT | type = 3 FIXED RANGE | type = 4 EVEN RANGE | type = 5 QUANTILE RANGE |
| description | Even gradient or uniform course from a minimum size to a maximum size. OR Even color gradient from one to an other color via any number of colors in between. | Classification into groups with custom boundaries. | Classification into groups with automatically even distributed boundaries. | Classification into groups whose boundaries are set by the use of the Quantile (also known as Percentile) - partitions the data in percentage groups.* * read more about Quantile at wikipedia.org/Quantile |
| calculation basis | The even gradient assigns every object (its number value) to an individual color or size. SIZE: The smallest number is assigned to the first set Marker size, the largest number to the second one. In between the Marker sizes are spread continuously and evenly. More about sizes here. COLOR: Based on the set colors (two or more) a scale of RGB values is created between the smallest and the largest number. The smallest number is assigned to the first set color, the largest number to the last one. Any intermediate colors set are evenly spread in between. The scale creates all possible shades of the colors set in the class. (The use of Marker images instead of colors is not possible in this class type, due to logical reasons) More about colors here. | The number values are assigned to groups with custom boundaries. The groups are defined by a minimum (smallest number in this group) and a related color/image or Marker size. Like this any number of groups can be configured. This class type turns out to be the only one keeping the same appearance for the objects, even if selections are taken. More about sizes here. More about colors here. | The difference between the smallest and the largest number is divided in as many equal groups, as there are records (colors/images or sizes) set in the class. More about sizes here. More about colors here. | The quantile mode sorts the numbers in ascending order and splits them into groups, each with the same amount (!) of numbers in them. The numerical values themselves are irrelevant in this case. The records (colors/images or sizes) set in the class define the number of groups being created. Example``: numbers: [12, 8, 5, 21, 14, 13] result of allocation with three entries: Group 1: [5, 8], Group 2: [12, 13], Group 3: [14, 21] the groups represent each 33% of the data That's how this class type shows percentage distribution. More about sizes here. More about colors here. |
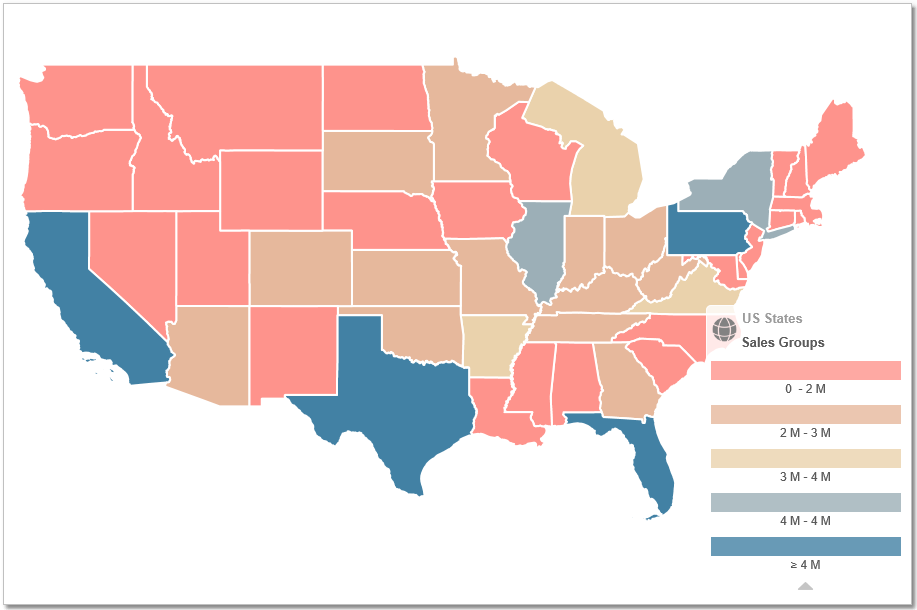
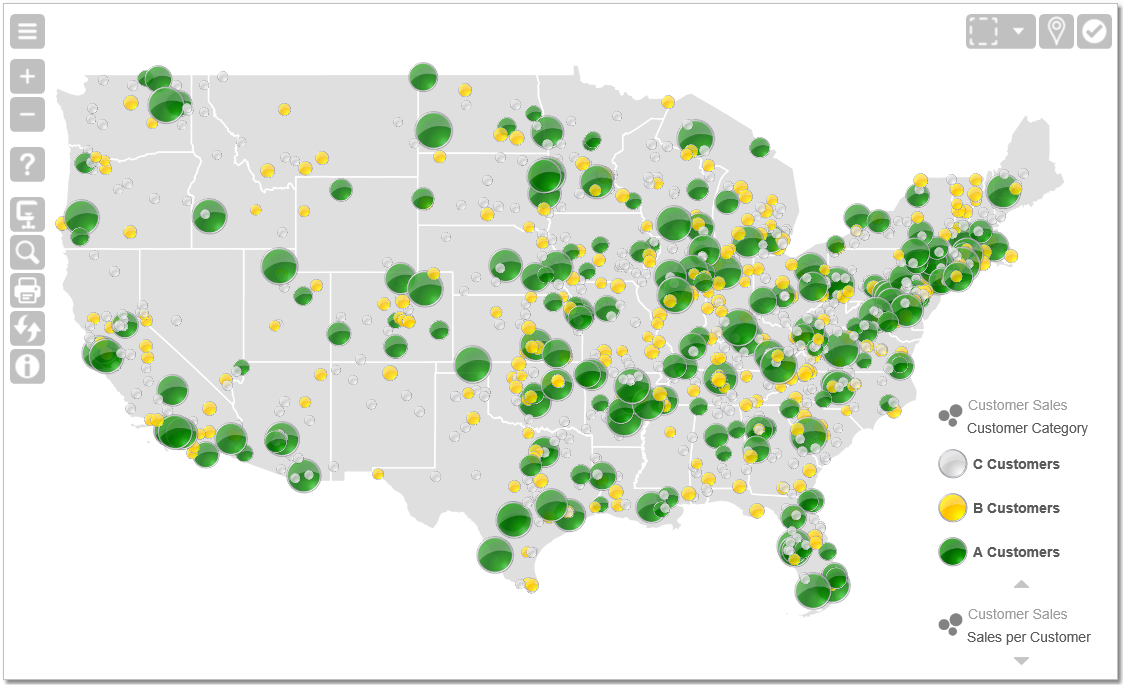
| example | The following example is about 100 customers (Markers) in the US (states = Polygons) with sales between about $ 50,000 and $ 900,000. Markers show the sales of each customer, Polygons sum them up per state. Different class types turn out different conclusions - all in all this business has most customers in the eastern part of the US, but has best total sales in California and Texas. | |||
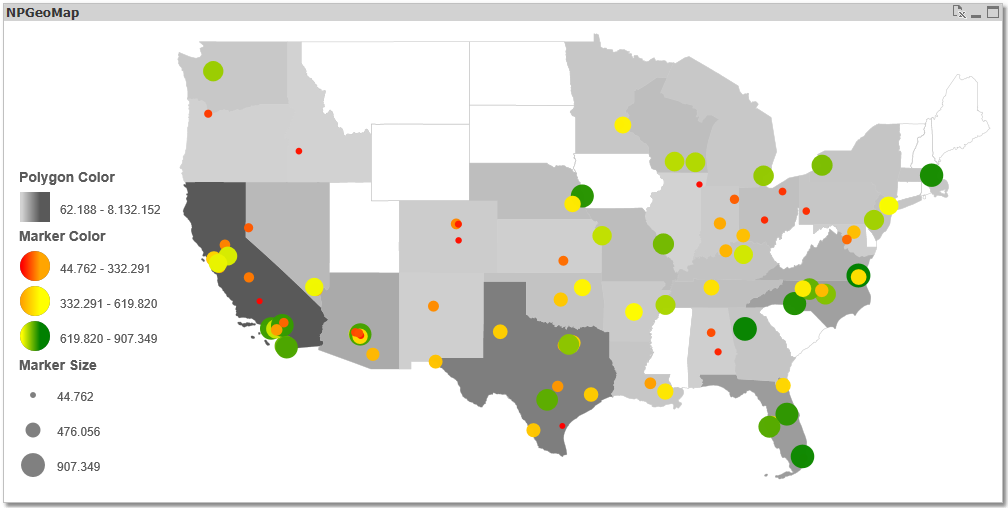 | 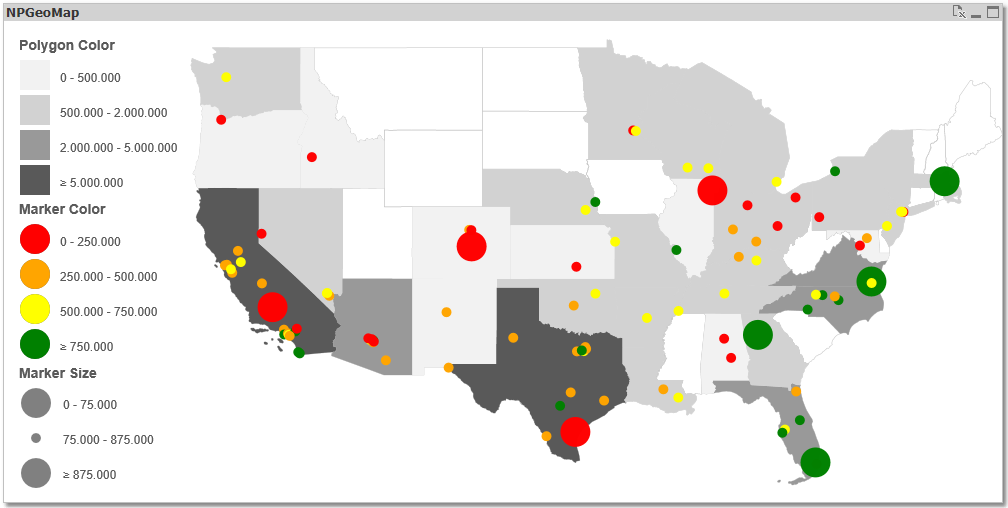 | 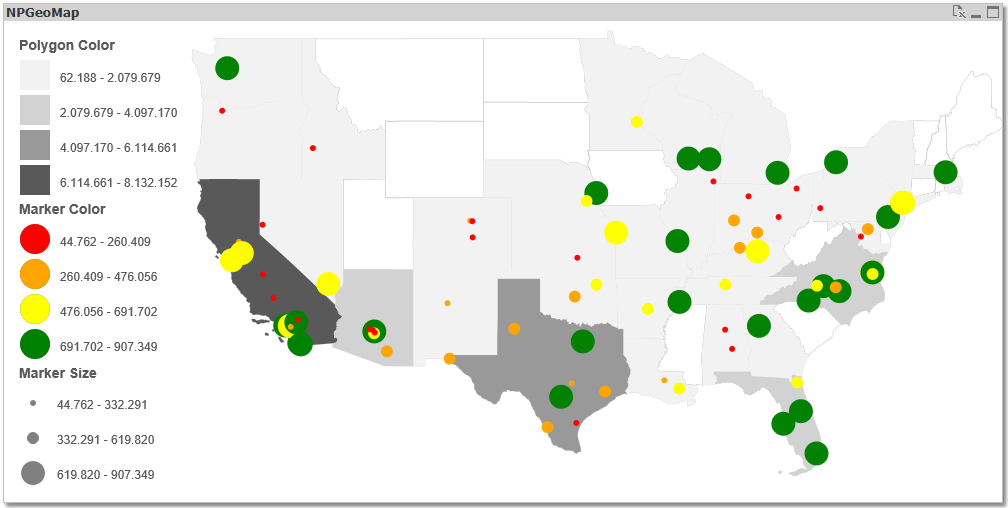 | 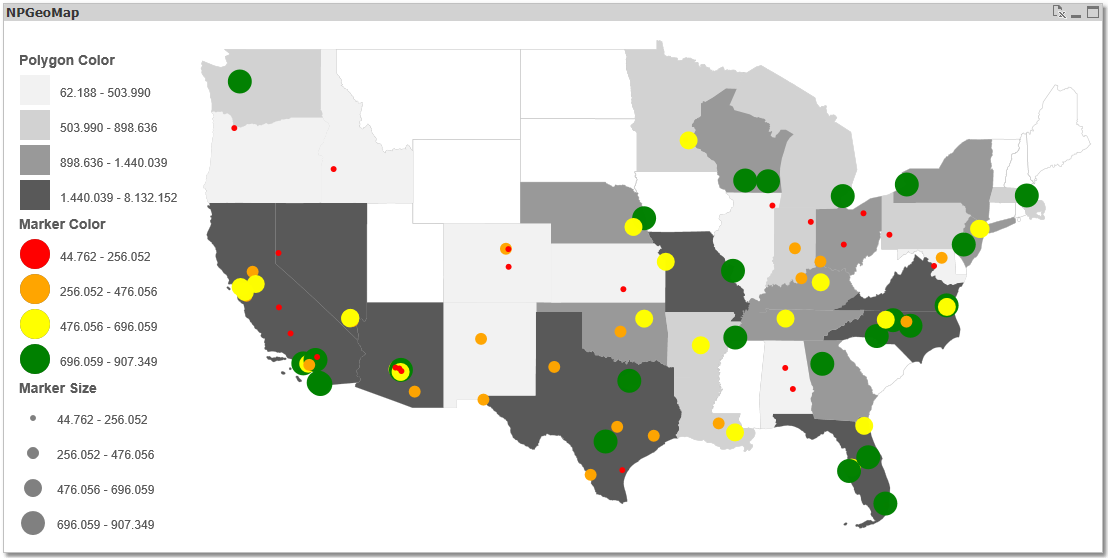 | |
This class type turns out clearly that California is the best selling state, although more "green" and good customers are located in the eastern states. Looks like the turnover correlates with the population. | Here you can see at a glance that the three major customers are located along the east cost. Two out of the four smallest turnovers are located in the two best selling states California and Texas. | This map shows that most of all states are not selling more than about two million dollars. The business could be focused on the five most worthwhile states. | The Markers on this map show clearly, that the better 50% of customers live in the eastern part of the US. The south west coast is still the best selling region at all. | |
| explanation | The Even Gradient assigns every number to an individual color or size value. Therefore more subtle differences appear and outliers can be detected very easily. | When the numbers are known, one advantage of the Fixed Range is to show "nice" and rounded numbers in the legend. Another advantage is to configure the steps and intervals of the ranges individually. This is what makes it the most flexible class type. Moreover this class type turns out to be the only one keeping the same appearance for the objects, even if selections are taken. This is how synthetic Legends can be configured. | When the numbers could change dynamically or are simply unknown, the system can do the work for you and divide them up into equal units, just as they come. | Using the Quantile Range reveals percentage insights, because this type doesn't refer to the number values, but just to the amount and position of them. Depending on how many segments are set it shows thirds, quarters and so on. |
Technical Summary
As you can add and configure as many classes as you need by using the existing ones as templates, this table shows the most essential technical indications for each type:
| type | default name (ID) Used as variable in the setting Objects - change them as you need! | useable for | requirements | calculation basis |
| type = 1 | EVEN_GRADIENT_SIZE | sizes only (Markers) | a minimum size and a maximum size | The even gradient assigns every object (its number value) to a individual size. The smallest number is assigned to the first set Marker size, the largest number to the second one. In between the Marker sizes are spread continuously and evenly. Example``: scaleminsize=5, scalemaxsize=15 (more about these settings here``) numbers: [20,30,32,40] Marker size results: [5,10,11,15] Therefore every Marker gets his own size value - only identical number values get the same size. More about sizes here. |
| type = 2 | EVEN_GRADIENT_COLOR | colors only (Polygons und Markers) | two or more colors | The even gradient assigns every object (its number value) to a individual color. Based on the set colors (two or more) a scale of RGB values is created between the smallest and the largest number. The smallest number is assigned to the first set color, the largest number to the last one. Any intermediate colors set are evenly spread in between. The scale creates all possible shades of the colors set in the class. Every object gets his own color shade - only identical number values get the same color. More about colors here. |
| type = 3 | FIXED_RANGE_COLOR FIXED_RANGE_SIZE | each for colors and sizes (Polygons und Markers) | for each group (range) a minimum number value (range start) and a color or size | The number values are assigned to groups with custom boundaries. The groups are defined by a minimum (smallest number in this group) and a related color/image or Marker size. Like this any number of groups can be configured. This class type turns out to be the only one keeping the same appearance for the objects, even if selections are taken - what makes it possible to create synthetic Legends. More about sizes here. More about colors here. |
| type = 4 | EVEN_RANGE_COLOR EVEN_RANGE_SIZE | for each group (range) a color or size | The difference between the smallest and the largest number is divided in as many equal groups, as there are records (colors/images or sizes) set in the class. More about sizes here. More about colors here. | |
| type = 5 | QUANTILE_RANGE_COLOR QUANTILE_RANGE_SIZE | for each group (range) a color or size - the amount of color or size values define the type of quantile (thirds, quarters,...) | The quantile mode sorts the numbers in ascending order and splits them into groups, each with the same amount (!) of numbers in them. The numerical values themselves are irrelevant in this case. The records (colors/images or sizes) set in the class define the number of groups being created. Example``: numbers: [12, 8, 5, 21, 14, 13] result of allocation with three entries: Group 1: [5, 8], Group 2: [12, 13], Group 3: [14, 21] More about sizes here. More about colors here. More about Quantile at wikipedia.org/Quantile |
Any number of Classes can be set in this this fx-editor by using the types and requirements in the table above. All eight possible Classes (each four for colors and sizes) are already in the dialog by default and can be used as templates.
From here on begins the explanation of all the settings in this fx-editor:
| COLOR & SIZE CLASSES | ||||
|---|---|---|---|---|
| SETTING / VALUES | EXPLANATION | |||
| Legend | As soon an a Layer using classes is enabled, a Legend is displayed. (The Legend can be disabled individually or just hidden using the Layerswitcher.) Legends are not only for information, but a powerful analysis tool - they steer PopUpVariables, take Selections, change and recalculate dynamically and interact with the map using a Highlight effect. Tooltips show the amount of objects the Legend segments contain - if the cursor hovers over a caption, the Tooltip even sums up the amounts of the segments included. Legend segments of Cluster show both the amount of Clustermarkers or Hexagons and the amount of Markers clustered by them. There are a lot of settings to configure the appearance of the Legend. All groups in the Legend can be collapsed for better visibility. The Legend itself can either be docked on the side to not overlap the map or dragged freely somewhere in the object. | |||
| active 1 Legend is basically displayed (default) 0 Legend is not displayed | Defines if Legend should be displayed basically or not. In addition, the classes may be controlled individually with the setting legend - therefore you can define for each class separately if this specific class should be displayed in the legend or not. With the small arrows each legend group can be collapsed. While operating in the app the whole legend may be hidden using the Layerswitcher. (Attention: If you don't need the Legend, to increase performance it's better to actually deactivate it here - the Layerswitcher only hides it, but it will be still loaded.) | |||
| dock 0 legend is freely movable (default) 1 legend docked on the right 2 legend docked on the left | Docks the legend on the right or left side. If your Legend is quite comprehensive, it may be useful to put it somewhere to the side so that it not covers major parts of the map. Or if the legend is even bigger, it may happen that the object is not high enough to display the whole legend. Therefore the legend can be docked to the left or right side of the object. If the legend is higher than the object, a scroll bar appears and legend no longer covers any of the map (the docking part has it's own section in the object, so the map is only rendered in its area). As long as the legend is not docked, it may be dragged freely somewhere on the map. (The following feature can set a specific position on the map.) No matter what is set here, the Layerswitcher still may hide and unhide the legend at any time. 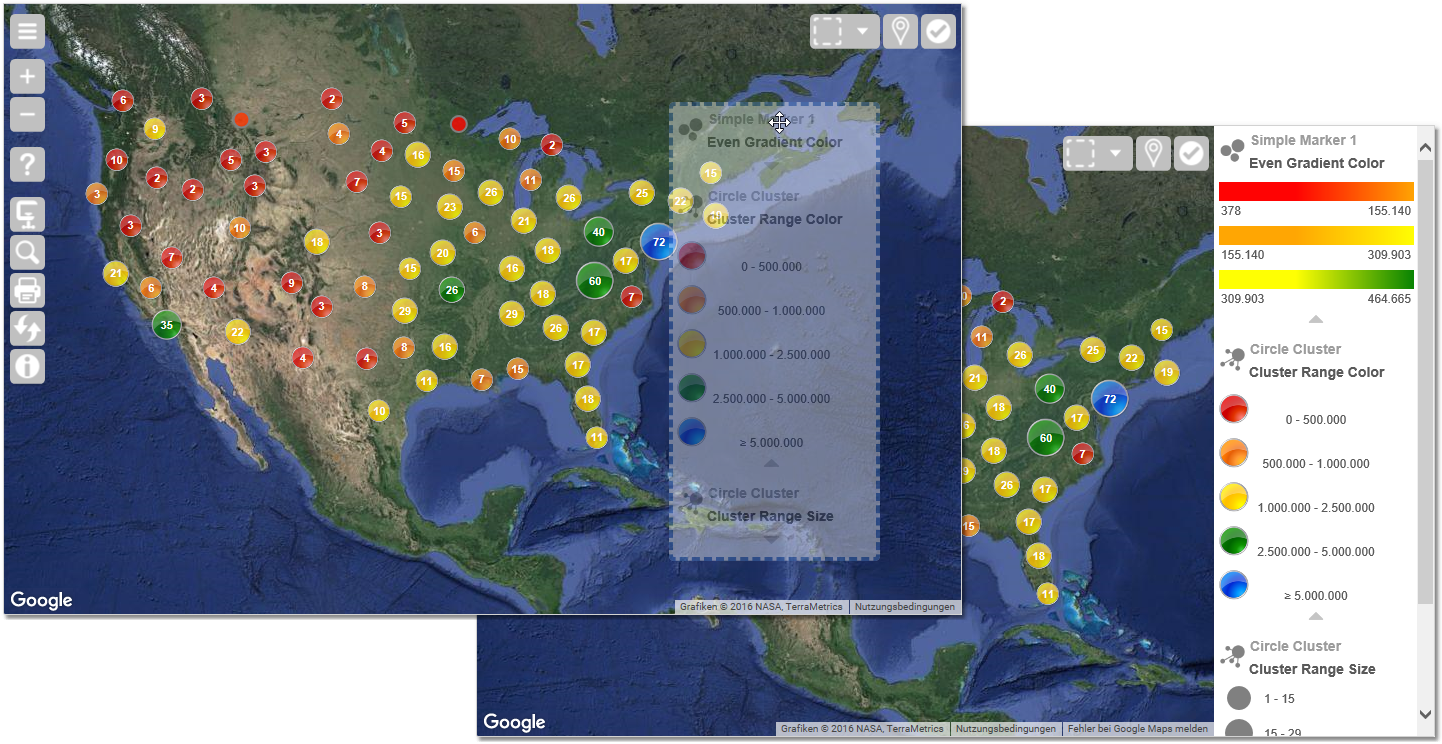 | |||
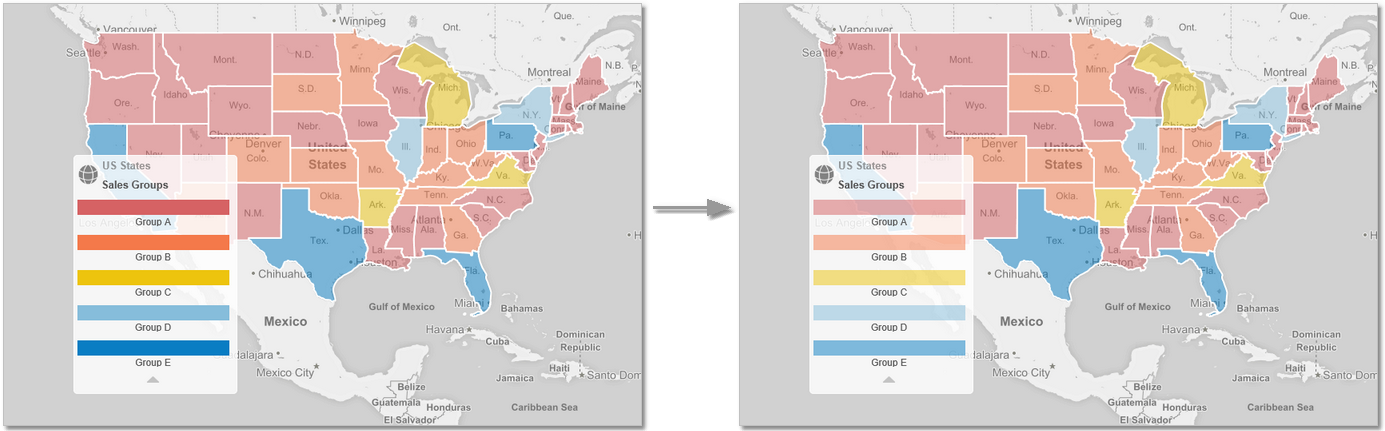
| opacity number Transparency of the symbols in the legend in percent % (default is 0) | Defines the transparency of the color symbols in the legend. Since the transparency optically changes the shade of the colors (they seem milky and light) this setting can adjust the colors of the symbols to the actual color of Polygons or Markers on the map, in case they have a transparency as well. For example if the Polygons in the map are set to a transparency of 50%, the symbols in the legend can be adjusted to the same transparency of 50% to have the exact same colors in the legend and on the map: | |||
 | ||||
| currencysymbol character Currency symbol to be used in the legend (default is the Euro sign "€") | Defines the used currency symbol in the legend. (This setting overwrites the one in the Expert Settings.) It defines which symbol would be used in the legend in general. It can be configured separately for each class, if a currency symbol should be displayed or not - see more further below at numberformat. | 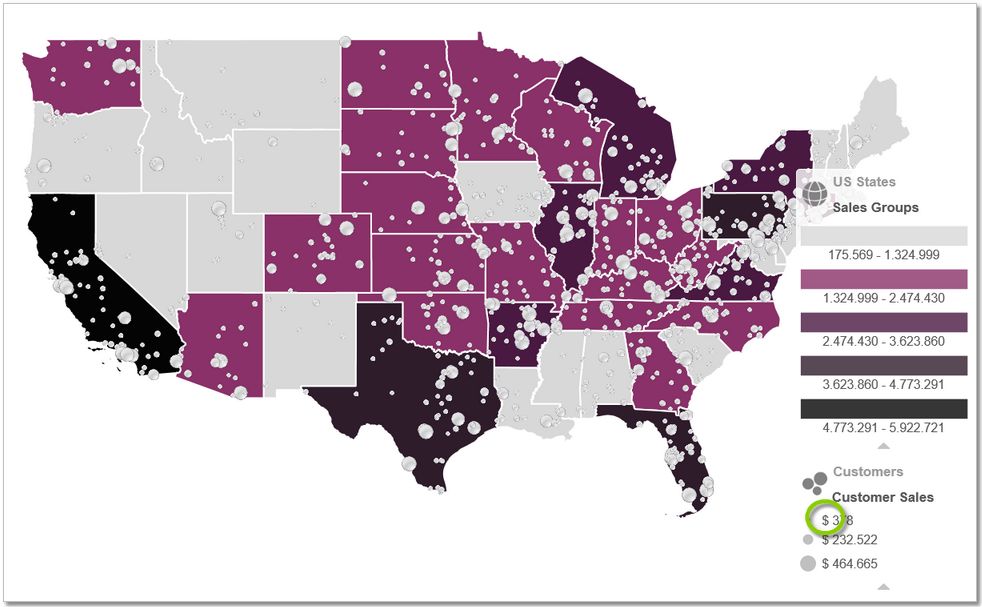 | ||
| headerfont font Font of the legend header (default is Arial) | Type, weight, color and size of the legend header font. | 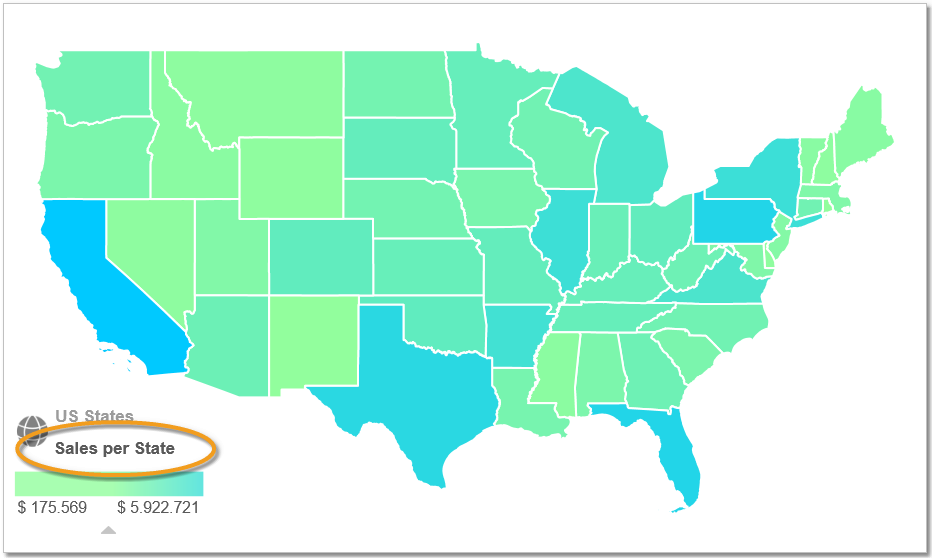 | ||
| headerfontweight fontweight value Fontweight of the legend header (default is "bold") | ||||
| headerfontcolor color Font color of the legend header (default is "#5a5a5a") | ||||
| headerfontsize number Font size of the legend header (default is 20) | ||||
| captionfont font Font of the legend captions (default is "Arial") | Type, weight, color and size of the legend caption font. | 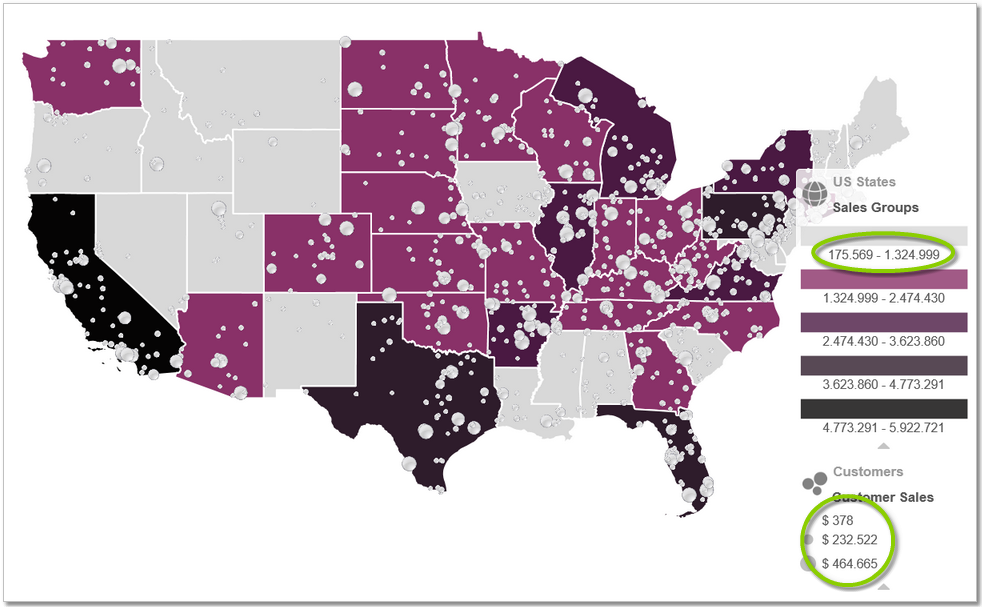 | ||
| captionfontweight fontweight value Font weight of the legend captions (no default value - font will be displayed like "normal") | ||||
| captionfontcolor color Font color of the legend captions (default is "#5a5a5a") | ||||
| captionfontsize number Font size of the legend captions (default is 18) | ||||
| Class | ||||
| color class name/ID image class name/ID MAP and LINE only: imagesize class name/ID LINE only: width class name/ID MARKER only: size class name/ID MARKER only: bordercolor class name/ID MARKER only: bordersize class name/ID | These settings assign a Class to an object. It's not necessary to create a particular Class for each object - the ID of any Class may be used for several objects. Just mind to distinguish between Classes for automatic colors or them for automatic Sizes. For example the same color gradient could be used for Polygons and Markers. But if different colors are needed, just copy-paste the class and change them. Enter the name (the ID) of the respective Class in these settings. This name can be changed as needed - it's just a variable to clearly assign the Classes to the objects. Make sure to use the same notation here and in the Class name/ID. Example``: default name (ID): "color": "EVEN_GRADIENT_COLOR" custom name (ID): "color": "Branch_Sales_Color" Classes may also be set for Simple Markers, Simple Maps and Cluster. Since especially the Simple objects can be differentiated (each Simple Block may use a different Class), the Class names/IDs are set in their respective dialogs. | |||
| Classes | ||||
| The following settings are the same for each Class. They are explained in this table once and apply for all Classes. The "name"/ID of the Classes (default in capital letters, always at the beginning of a Class) may be changed at any time - it's just a variable to clearly assign a Class to an object. Beware to use the same ID and notation here and in the object settings. If you create a new Class by copying an existing one, make sure to change the ID as well in order to keep it unique. | ||||
| type number class type, default names in the same order as they appear in the dialog: EVEN_GRADIENT_COLOR EVEN_RANGE_COLOR FIXED_RANGE_COLOR QUANTILE_RANGE_COLOR EVEN_GRADIENT_SIZE EVEN_RANGE_SIZE FIXED_RANGE_SIZE QUANTILE_RANGE_SIZE CLUSTER_RANGE_SIZE CLUSTER_RANGE_COLOR | The class type is like a mode - it defines the way the class works and calculates. Following types are available: | |||
| type | default name | short description | ||
| type=1 | EVEN_GRADIENT_SIZE | Even gradient or uniform course from a minimum size to a maximum size. | ||
| type=2 | EVEN_GRADIENT_COLOR | Even color gradient from one to an other color via any number of colors in between. | ||
| type=3 | FIXED_RANGE_COLOR FIXED_RANGE_SIZE | Classification into groups with custom boundaries. | ||
| type=4 | EVEN_RANGE_COLOR EVEN_RANGE_SIZE | Classification into groups with automatically even distributed boundaries. | ||
| type=5 | QUANTILE_RANGE_COLOR QUANTILE_RANGE_SIZE | Classification into groups whose boundaries are set by the use of the Quantile* (also known as Percentile) | ||
| CLUSTER_RANGE_SIZE CLUSTER_RANGE_COLOR | The Cluster Classes both are actually just another Fixed Range, therefore they're as well type 3. | |||
| All Classes in this dialog can be used as templates - you can copy and configure them as needed. All eight possible classes (each four for colors/images and sizes) are already in the dialog by default. The name (ID) of the classes (default in capital letters, always standing at the beginning of each class as a kind of caption) can be changed at any time as needed. It's just a variable to clearly assign the respective class to the objects above. Make sure to use the same notation here and above. More about quantile further above or at wikipedia.org/Quantil More about class types as well further above. | ||||
| showlayercaption true/false | displayed in Legend header | |||
| caption text Heading displayed in the legend (default is the default class name above without underscores) | Displayed as heading in the legend. The second heading above is set in the menu of each Data Layer. | | ||
| legend true This class will be displayed in the legend (default) false This class won't be displayed in the legend | Defines if the respective class is displayed in the legend or not. Since classes can be used for several objects (Polygon colors, Marker colors,... ), it can be configured for each of them separately whether it should be displayed in the legend or not. You can also hide the whole Legend while working in the app, using the Layerswitcher. Individual Legend segments may be collapsed with the small arrows beneath each segment.  Beware: If you really don't need the Legend, it's better to actually disable it here in order to increase performance - the Layerswitcher only hides, but the Legend will be calculated anyway. | |||
| collapsed false Legend segment is not collapsed (default) true Legend segment is collapsed | Legend segments can be collapsed. While working in the app, the Legend segments can be collapsed with the small arrows beneath each segment, in order to get a better overview or save some space. This feature sets weather the respective segment is by default collapsed or not. | |||
| numberformat format Format and notation of numbers in the legend section of this class (default is 0,0 - that means with a thousand separator and no decimals) | Configure here the format and notation of numbers displayed in the legend section of each class. The following tools and variables are available: comma , = thousand separator period . = decimal separator dollar sign $ = currency symbol percentage sing % = converts number values in percent and display a percentage sign abbreviation a = number abbreviations like "Mio", "Tsd" etc. In Addition space characters and other symbols can be used directly. Which currency symbol should be basically used in NPGeoMap is configurable in the Expert Settings. Especially for the numbers in the legend, this can be overwritten in the separate setting currencysymbol further above in this dialog. Example (Screenshot on the right): "numberformat": "$ 0,000.00", Further examples: INPUT "numberformat": OUTPUT 1500.25 "0,0.00" 1.500,25 1500.25 "0" 1500 1500.25 "0,0.000" 1.500,250 1500.25 "$ 0,0.00" € 1.500,25 0.9 "0,0.00 %" 90,00 % 0.9 "0,0%" 90% | 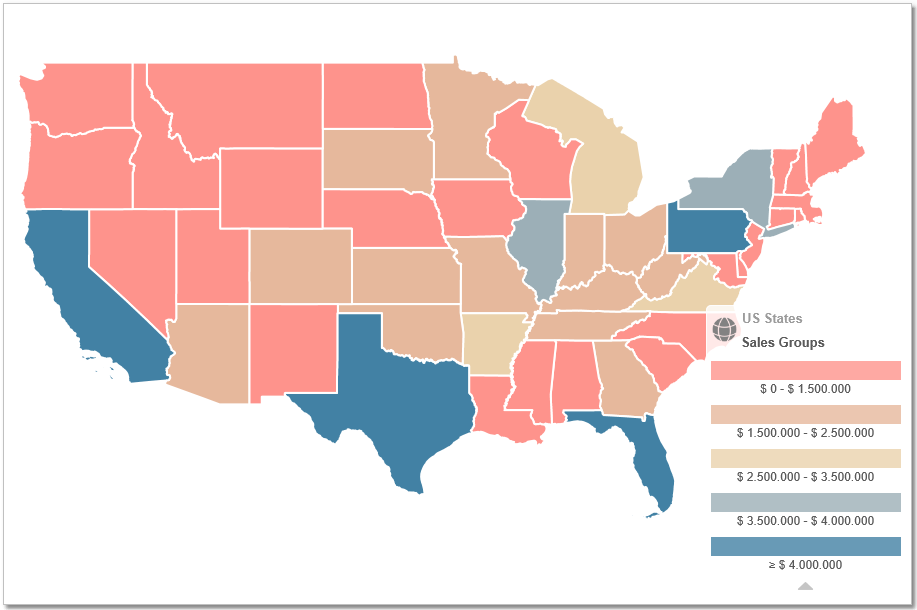 clilck to expand clilck to expand | ||
 clilck to expand clilck to expand | ||||
| nullvalue color | display empty or null values in a specific color When setting colors you can use Hex-Codes, HTML color names or RGB Example``: color red = #FF0000 or red or RGB(255, 0, 0) (Detailed information in chapter The fx-editor) | |||
| From this point on all settings with different requirements depending on the class type are explained, in the same order as the classes are in the dialog. The explanations of the specific settings are combined with a short summary about how the class type works. Order of all classes here and in the dialog: EVEN_GRADIENT_COLOR EVEN_RANGE_COLOR FIXED_RANGE_COLOR QUANTILE_RANGE_COLOR EVEN_GRADIENT_SIZE EVEN_RANGE_SIZE FIXED_RANGE_SIZE QUANTILE_RANGE_SIZE The name (ID) of the classes (default in capital letters, always standing at the beginning of each class as a kind of caption) can be changed at any time as needed. It's just a variable to clearly assign the respective class to the objects above. Make sure to use the same notation here and above. | 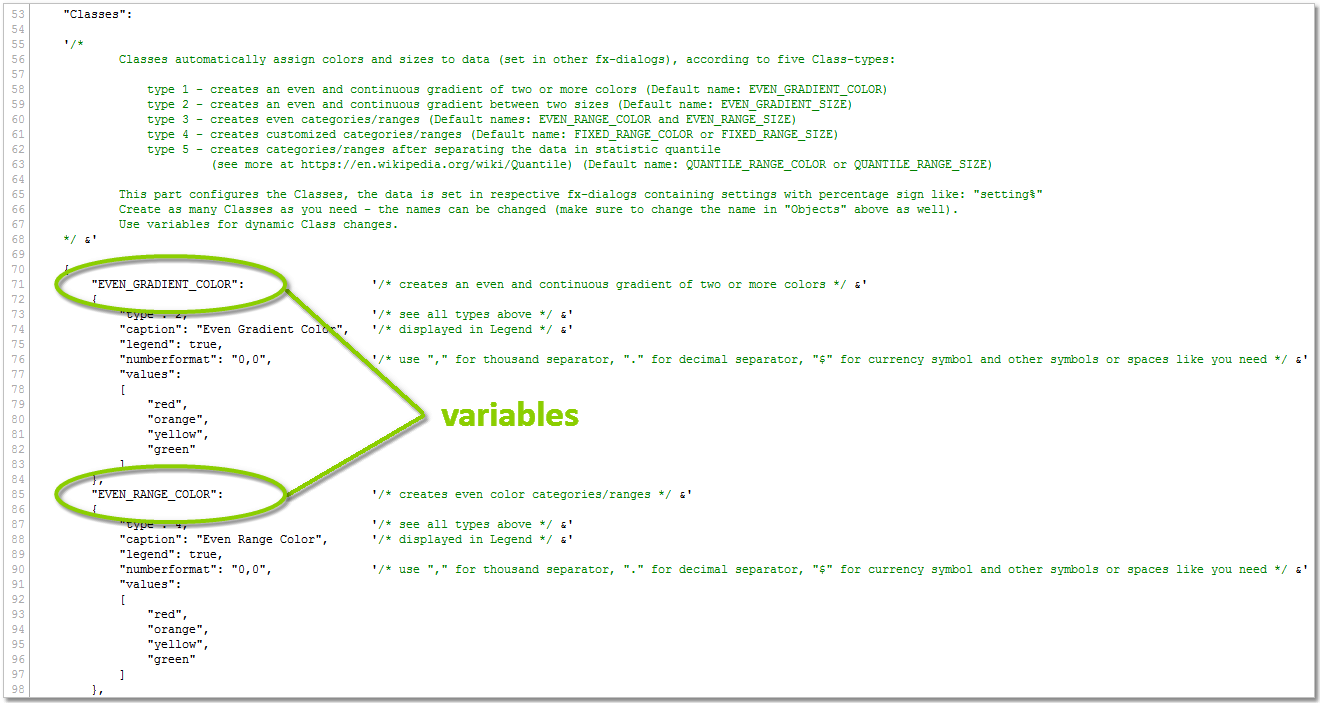 | |||
| EVEN_GRADIENT_COLOR name can be changed | = Even color gradient from one to an other color via any number of colors in between. calculation basis: The even gradient assigns every object (its number value) to a individual color. Based on the set colors (two or more) a scale of RGB values is created between the smallest and the largest number. The smallest number is assigned to the first set color, the largest number to the last one. Any intermediate colors set are evenly spread in between. The scale creates all possible shades of the colors set in the class. Every object gets his own color shade - only identical number values get the same color. | 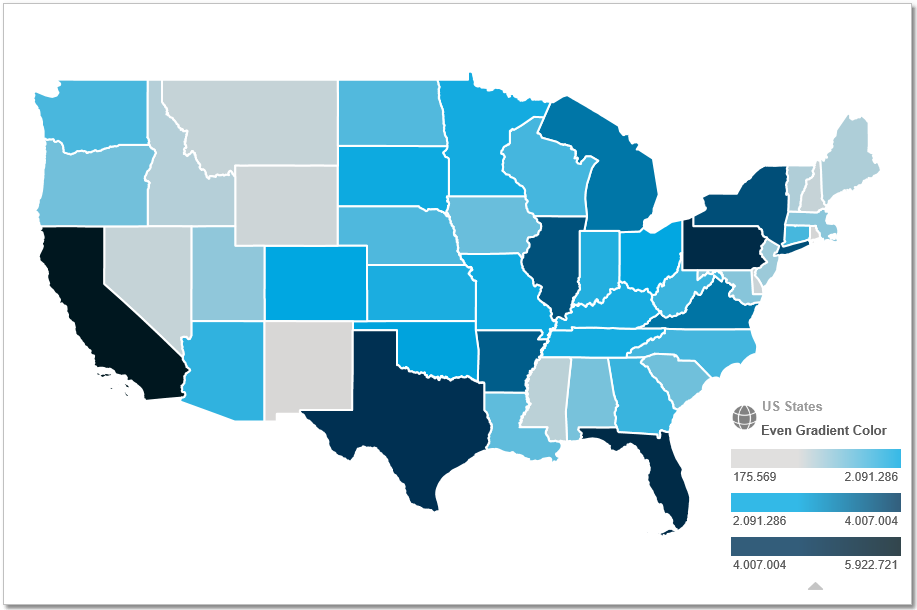 | ||
| values [color array] list of colors for an even gradient - two or more colors required | At least two colors have to be set to create an even color gradient. You can list any number of colors in between. The screenshot on the right shows a color gradient of three colors for Polygons.  For the best result only set one shade per color (or of course two, if only one color is used) - for example from gray to blue. Don't set any shades of the same color in between like darkgrey - grey - lightgrey, because it would distort the equability of the calculated colors in a gradient. When setting colors you can use Hex-Codes, HTML color names or RGB For the best result only set one shade per color (or of course two, if only one color is used) - for example from gray to blue. Don't set any shades of the same color in between like darkgrey - grey - lightgrey, because it would distort the equability of the calculated colors in a gradient. When setting colors you can use Hex-Codes, HTML color names or RGB Example``: color red = #FF0000 or red or RGB(255, 0, 0) (Detailed information in chapter The fx-editor) To create and code nice color combinations try uigradients.com, coolors.co or paletton.com. For reasons of logic no images can be used with a gradient. | |||
| EVEN_RANGE_COLOR name can be changed | = Classification into color groups with automatically even distributed boundaries. calculation basis: The difference between the smallest and the largest number is divided in as many equal groups, as there are records (colors/images) set in the class. | 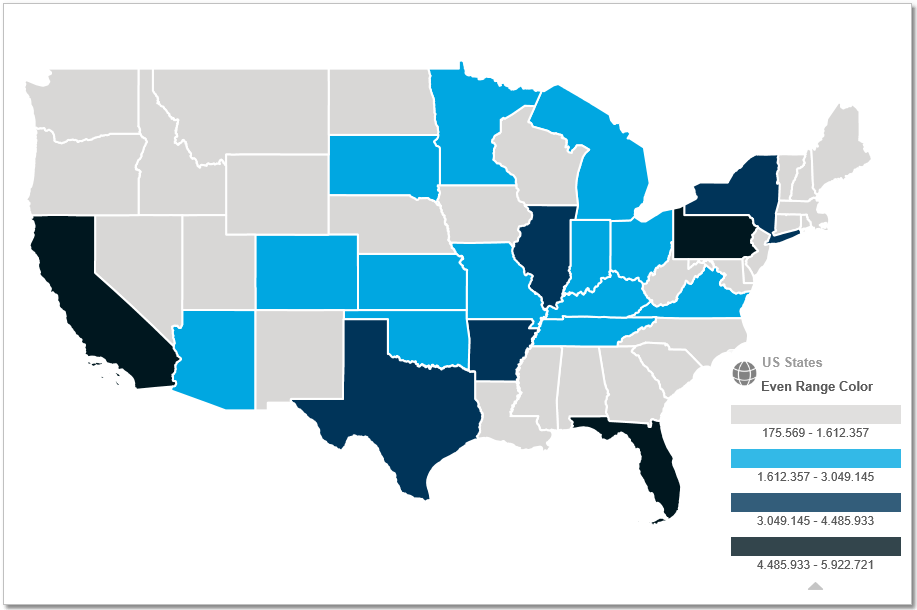 | ||
| values [color array] list of colors/images for an even range - number of entries defines number of groups | The number of set colors defines the number of created ranges/groups. When setting colors you can use Hex-Codes, HTML color names or RGB Example``: color red = #FF0000 or red or RGB(255, 0, 0) (Detailed information in chapter The fx-editor) To create and code nice color combinations try uigradients.com, coolors.co or paletton.com. Instead of colors you may also set Images (only for Markers of course). They can be resized dynamically, just like Markers would. Configure them by entering the file name of an Image instead of a color. Therefore the file has to be saved within the folder "images" in the NPGeoMap Extension Directory - add sub folders, if there are, like: Example (file right in folder "image"): "values": "flag.png", Beispiel (file in sub folder "demo"): "values": "demo/airplane.png", Just try those examples by copy-paste in your app - the given images are included in NPGeoMap already! You can also use animated GIF files. | |||
| FIXED_RANGE_COLOR name can be changed | = Classification into color groups with custom boundaries. calculation basis: The number values are assigned to groups with custom boundaries. The groups are defined by a minimum (smallest number in this group) and a related color/image. Like this any number of groups can be configured. This class type turns out to be the only one keeping the same appearance for the objects, even if selections are taken - what makes it possible to create synthetic Legends. | |||
| ranges [range array] list of ranges/groups rangestart number minimum value in this range/group values color color/image for this range/group label text label for this range/group | You can create as many ranges/groups as you need. Each range needs a rangestart (minimum number value in the range) and a value (color or image for the range). The first range/group can be set with a rangestart of "0" to make sure all numbers are included. When setting colors you can use Hex-Codes, HTML color names or RGB Example``: color red = #FF0000 or red or RGB(255, 0, 0) (Detailed information in chapter The fx-editor) To create nice color combinations try uigradients.com, coolors.co or paletton.com. Instead of colors you may also set Images (only for Markers of course). They can be resized dynamically, just like Markers would. Configure them by entering the file name of an Image instead of a color. Therefore the file has to be saved within the folder "images" in the NPGeoMap Extension Directory - add sub folders, if there are, like: Example (file right in folder "image"): "values": "flag.png", Beispiel (file in sub folder "demo"): "values": "demo/airplane.png", Just try those examples by copy-paste in your app - the given images are included in NPGeoMap already! You can also use animated GIF files. Since objects with a Fixed Range always keep the same appearance (the same assigned color or image), even if selections are taken, labels/text can be displayed instead of the number values (see second screenshot on the right). In this way individual or synthetic Legends may be configured to display categories, types, brands etc. | 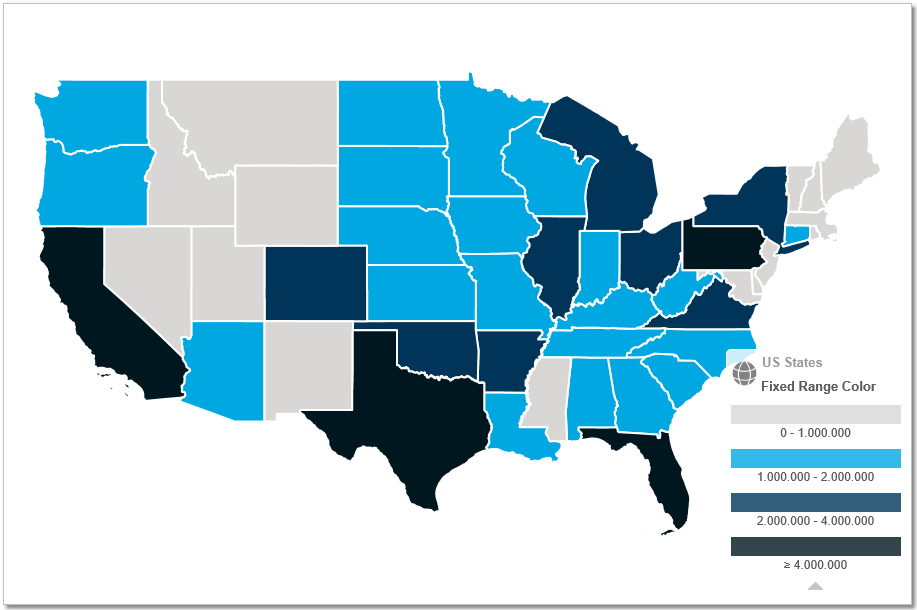 | ||
 | ||||
| QUANTILE_RANGE_COLOR name can be changed | = Classification into color groups whose boundaries are set by the use of the Quantile (also known as Percentile) -* partitions the data in percentage groups*.* * read more about Quantile at wikipedia.org/Quantile calculation basis: The quantile mode sorts the numbers in ascending order and splits them into groups, each with the same amount (!) of numbers in them. The numerical values themselves are irrelevant in this case. The records (colors) set in the class define the number of groups being created. Example``: numbers: [12, 8, 5, 21, 14, 13] result of allocation with three entries: group 1: [5, 8] - the first 33% of all numbers are in group 1 group 2: [12, 13] - the second 33% of all numbers are in group 2 group 3: [14, 21] - the last 33% of all numbers are in group 3 >> analysis: 66% of the entries are between 5 and 13, the other 33% are between 14 and 21 - so the major part is with the lower numbers. | 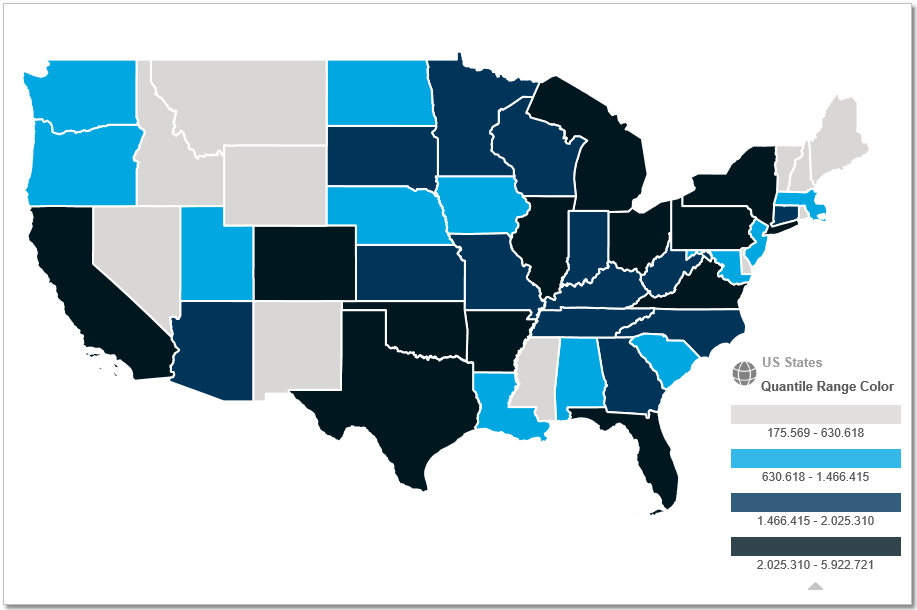 | ||
| values [color array] list of colors for an quantile range - number of colors defines number of groups (and type of quantile) | So the quantile separates the data in percentage groups. The number of colors/images defines the number of groups (ranges) and the type of quantile: 2 colors = median (50%-50%) 3 colors = tertiles (33%-33%-33%) 4 colors = quartiles (25%-25%-25%-25%) 5 colors = quintiles (20%-20%-20%-20%-20%) 10 colors = deciles (10%-10%-10%-10%-10%-10%-10%-10%-10%-10%) etc. More about quantile at wikipedia.org/Quantile When setting colors you can use Hex-Codes, HTML color names or RGB Example``: color red = #FF0000 or red or RGB(255, 0, 0) (Detailed information in chapter The fx-editor) To create nice color combinations try uigradients.com, coolors.co or paletton.com. Instead of colors you may also set Images (only for Markers of course). They can be resized dynamically, just like Markers would. Configure them by entering the file name of an Image instead of a color. Therefore the file has to be saved within the folder "images" in the NPGeoMap Extension Directory - add sub folders, if there are, like: Example (file right in folder "image"): "values": "flag.png", Beispiel (file in sub folder "demo"): "values": "demo/airplane.png", Just try those examples by copy-paste in your app - the given images are included in NPGeoMap already! You can also use animated GIF files. | |||
| EVEN_GRADIENT_SIZE name can be changed | = Even gradient or uniform course from a minimum Marker size to a maximum Marker size. calculation basis: The even gradient assigns every object (its number value) to a individual Marker size. The smallest number is assigned to the first set Marker size, the largest number to the second one. In between the Marker sizes are spread continuously and evenly. Example``: scaleminsize=5, scalemaxsize=15 (more about these settings here``) numbers: [20,30,32,40] Marker size results: [5,10,11,15] Therefore every Marker gets his own size value - only identical number values get the same size. | 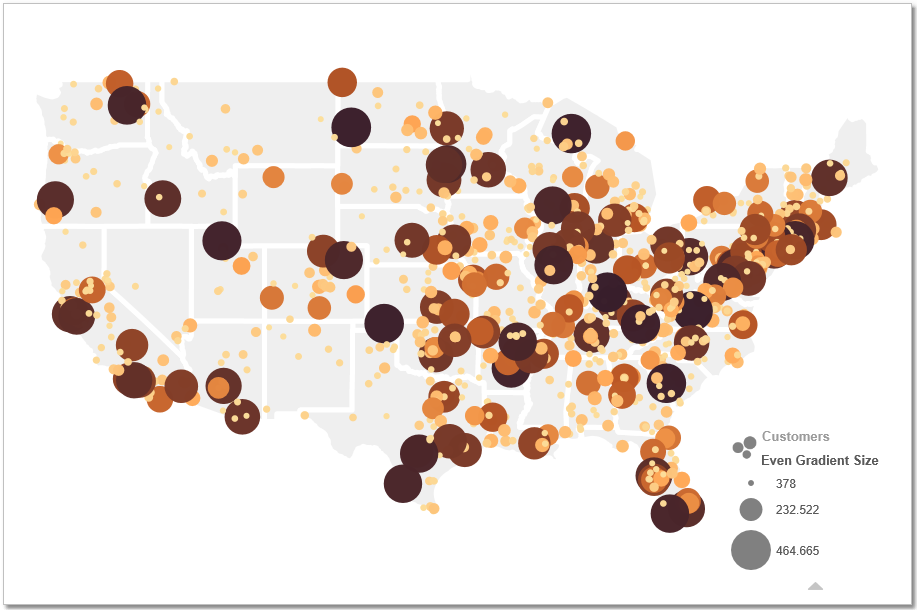 | ||
| legendsegments number number of segments displayed in legend | The scaleminsize is the smallest Marker size, the scalemaxsize is the biggest one in the course. Intermediate sizes cannot be set in this classtype - wouldn't be logical. However with legendsegments can be defined in how many equal steps (segments) the gradient should be displayed in the legend. In the screenshot on the right for example is legendsegments set to "3". unit = pixel | |||
| scaleminsize number minimum Marker size | ||||
| scalemaxsize number größte Marker-Größe | ||||
| EVEN_RANGE_SIZE name can be changed | = Classification into Marker size groups with automatically even distributed boundaries. calculation basis: The difference between the smallest and the largest number is divided in as many equal groups, as there are records (Marker sizes) set in the class. | 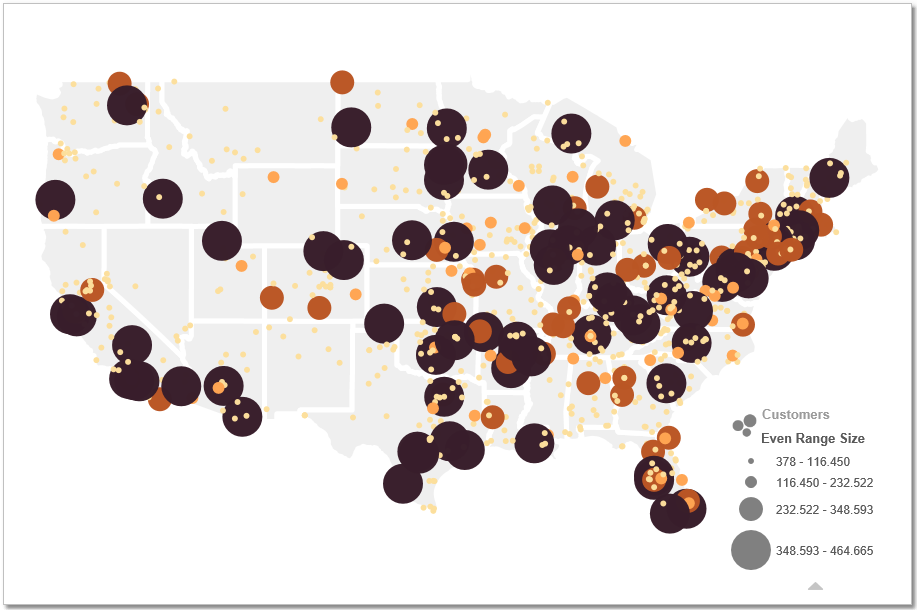 | ||
| values [number array] list of Marker sizes for an even range - amount of sizes defines amount of groups | The amount of set Marker sizes defines the amount of created ranges/groups. unit = pixel | |||
| FIXED_RANGE_SIZE name can be changed | = Classification into Marker size groups with custom boundaries. calculation basis: The number values are assigned to groups with custom boundaries. The groups are defined by a minimum (smallest number in this group) and a related Marker size. Like this any number of groups can be configured. This class type turns out to be the only one keeping the same appearance for the objects, even if selections are taken - what makes it possible to create synthetic Legends. | |||
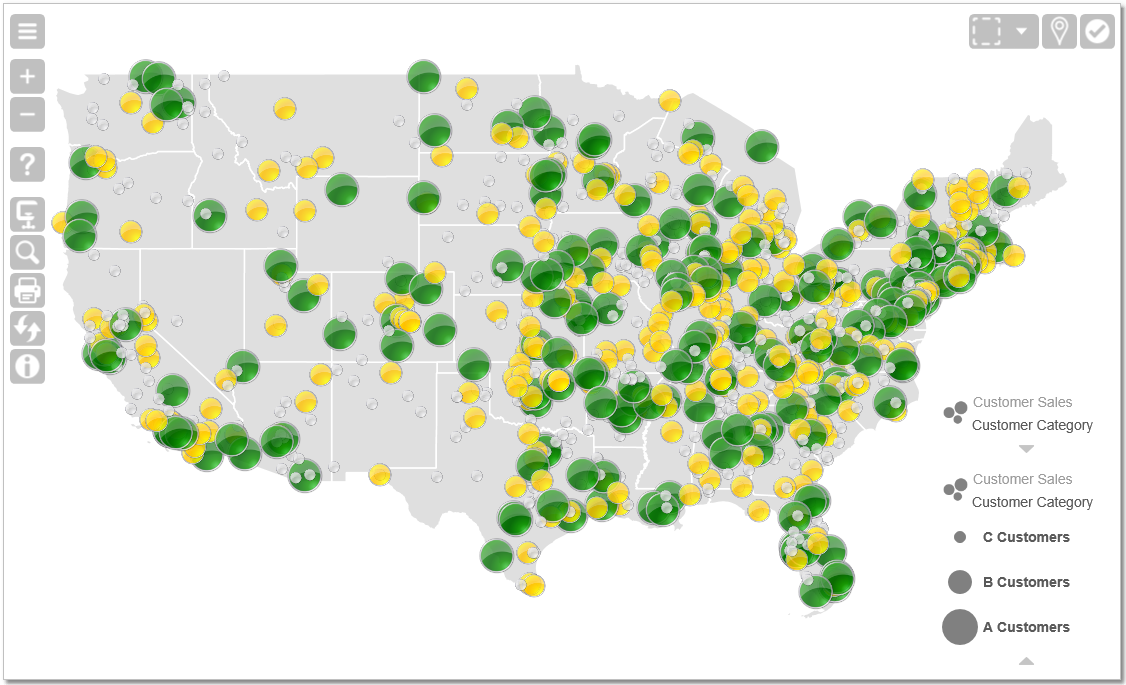
| ranges [range array] list of ranges/groups rangestart number minimum value in this range/group values number Marker size for this range/group label text label for this range/group | You can create as many ranges/groups as you need. Each range needs a rangestart (minimum number value in the range) and a value (Marker size for the range). The first range/group can be set with a rangestart of "0" to make sure all numbers are included. unit = pixel Since Markers with a Fixed Range always keep the same appearance (the same assigned size), even if selections are taken, labels/text can be displayed instead of the number values (see second screenshot on the right). In this way individual or synthetic Legends may be configured to display categories, types, brands etc. | 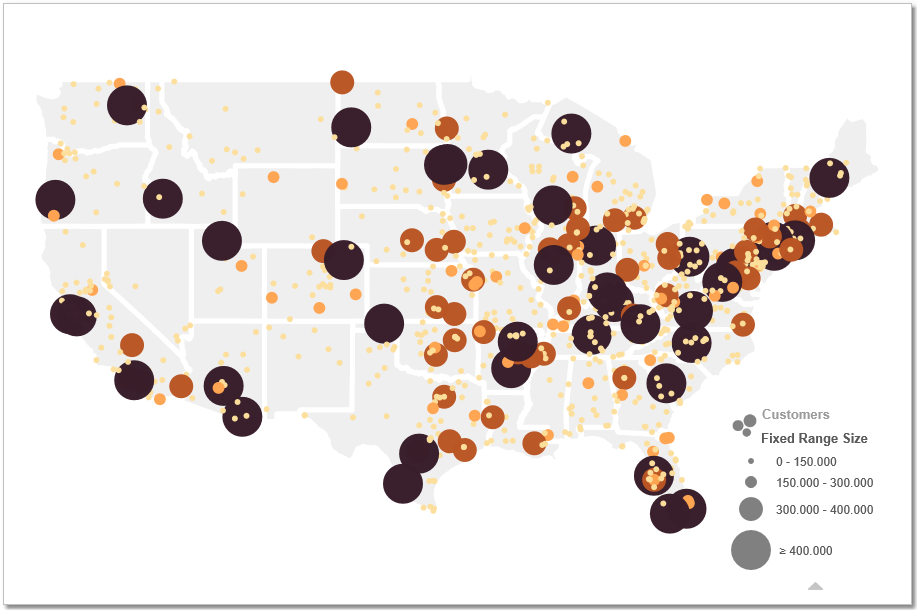 | ||
 | ||||
| QUANTILE_RANGE_SIZE name can be changed | = Classification into Marker size groups whose boundaries are set by the use of the Quantile (also known as Percentile) -* partitions the data in percentage groups*.* calculation basis: The quantile mode sorts the numbers in ascending order and splits them into groups, each with the same amount (!) of numbers in them. The numerical values themselves are irrelevant in this case. The records (Marker sizes) set in the class define the number of groups being created. Example``: numbers: [12, 8, 5, 21, 14, 13] result of allocation with three entries: group 1: [5, 8] - the first 33% of all numbers are in group 1 group 2: [12, 13] - the second 33% of all numbers are in group 2 group 3: [14, 21] - the last 33% of all numbers are in group 3 >> analysis: 66% of the entries are between 5 and 13, the other 33% are between 14 and 21 - so the major part is with the lower numbers. | 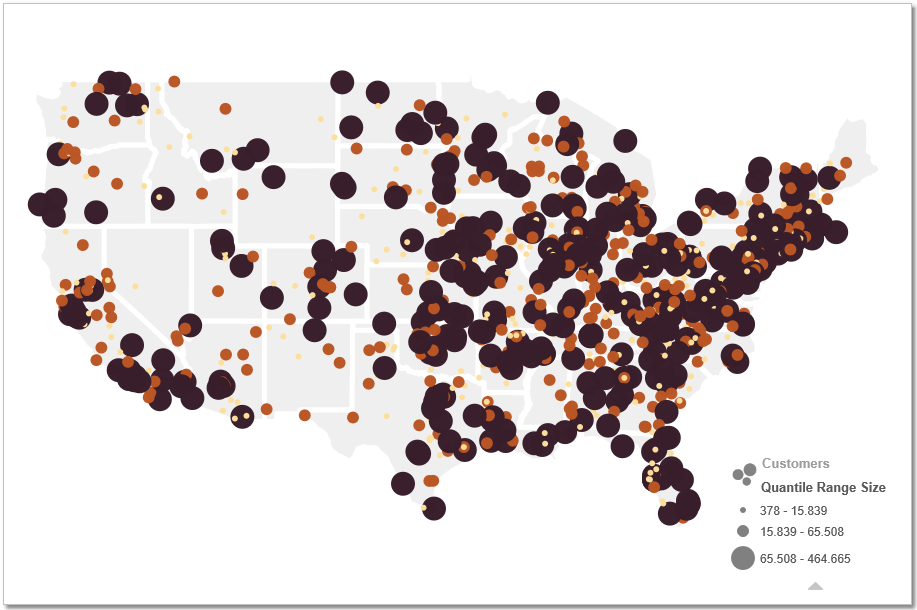 | ||
| values [number array] list of Marker sizes for an quantile range - amount of sizes defines amount of groups (and type of quantile) | So the quantile separates the data in percentage groups. The number of colors defines the number of groups (ranges) and the type of quantile: 2 Marker sizes = median (50%-50%) 3 Marker sizes = terciles (33%-33%-33%) 4 Marker sizes = quartiles (25%-25%-25%-25%) 5 Marker sizes = quintiles (20%-20%-20%-20%-20%) 10 Marker sizes = deciles (10%-10%-10%-10%-10%-10%-10%-10%-10%-10%) etc. More about quantile at wikipedia.org/Quantile unit = pixel |